Although photography is an art form; art is only the thought and effect expressed by the results eventually the ultimate thing which presents your creativity. In the process of creating images, we inevitably have to touch technology and with the help of that, we are able to control the final artistic expression more easily.
The biggest feature of the technology is that everything can be represented by the most intuitive figures. Whether in the process of shooting digital images or in the post-processing of images and for this eventually, we access the histograms. We don’t need to understand how the histogram works. Just know how to read the histogram and how to use the histogram to control the shot and tune the image you are taking.
A standard histogram can be divided into five areas, from left to right in the histogram, from the darkest part to the brightest part of the picture, divided into the black level, shadow, midtones, highlight, whites.
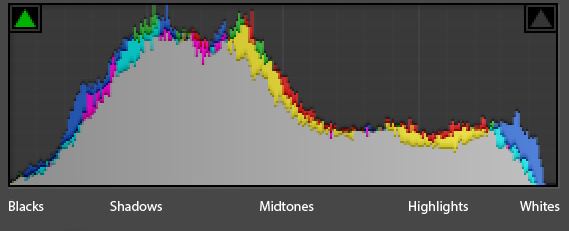
In simple terms, the histogram is the overall brightness distribution in the picture you take. The horizontal coordinate in the figure shows the brightness distribution of the image. The leftmost is the darkest, the rightmost is the brightest, and the ordinate is shown here. The distribution of pixels in the luminance region, the region where the peaks are concentrated, is the concentration of this luminance in the image.
To put it bluntly, the histogram of the photo can express the color of the photo straightforwardly.
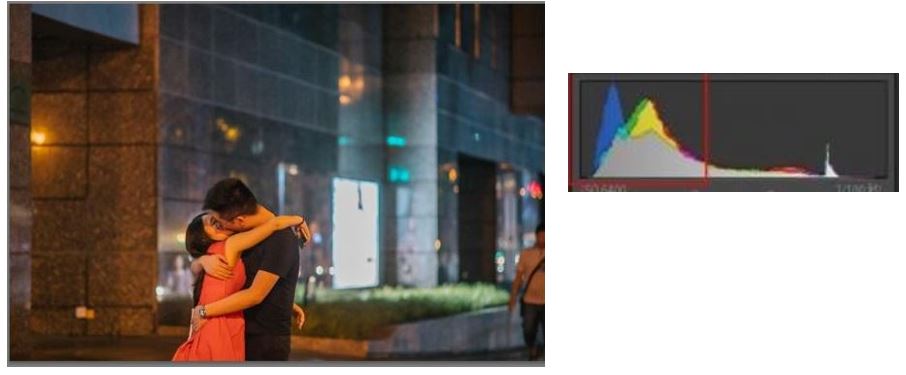
If the peaks in the histogram are concentrated on the left side, the overall color of the photo is darker and belongs to a dark tone photo, like the one below:
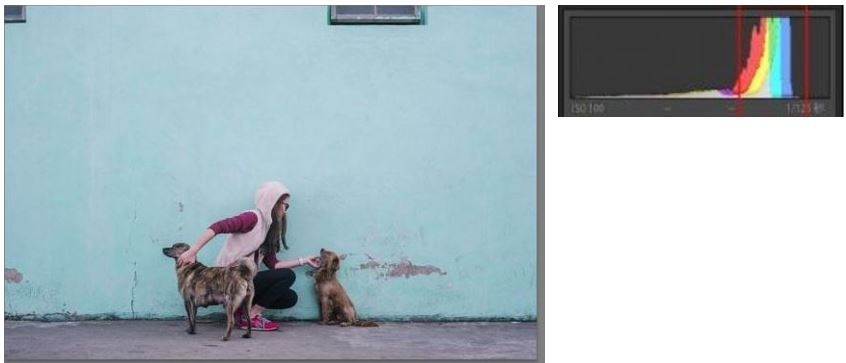
If the peaks are concentrated on the right side of the histogram, then the overall color of the photo is bright and belongs to a high-profile photo, like the one below:
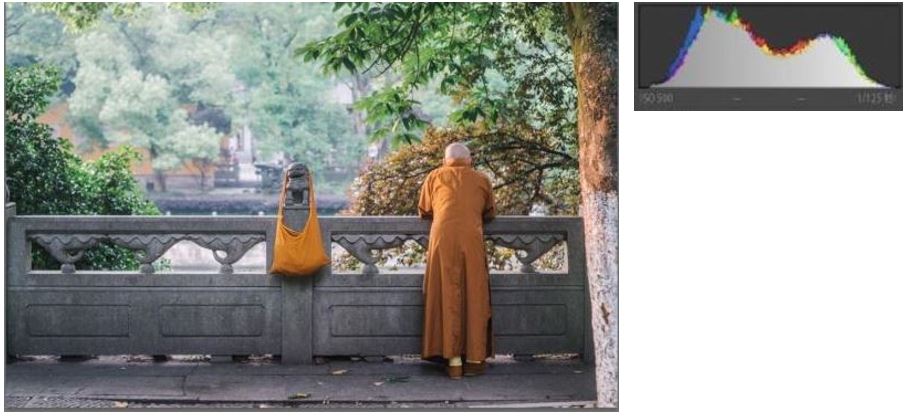
If the peak is in the middle of the histogram, it means that the photo is a mid-tone photo with a moderate overall tone that is neither too bright nor too dark:
Knowing the meaning of the expressions in each area of the histogram, how can we help us understand the photos?
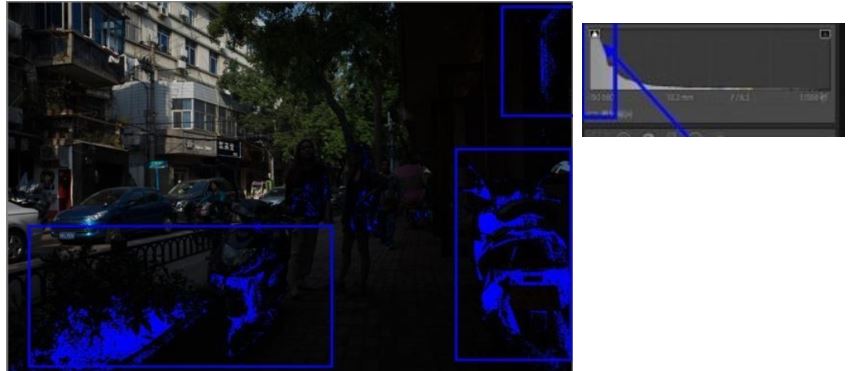
First, it helps us determine if there is an underexposure or overexposure in a photo.
The left and right ends of the histogram are extreme, that is, on the leftmost line, it is a pure black area of 0,0,0, and on the far right line, it is a pure white area of 255,255,255. If the pixels in the photo stay in these two areas, it means that there is a lot of dead white or dead black in the photo. These areas have no details. We should consider whether we need to increase or decrease the exposure when shooting. The exposure of these areas moves, details appear, or multiple different photos are taken and post-processed.
Just like the two photos below, which are overexposed and underexposed. We can see the overexposed or underexposed areas in the picture, and these areas can be expressed in the histogram. In other words, when we shoot, by reading the histogram, you should be able to find it.

In addition, reading the histogram helps us determine the hue of the image.
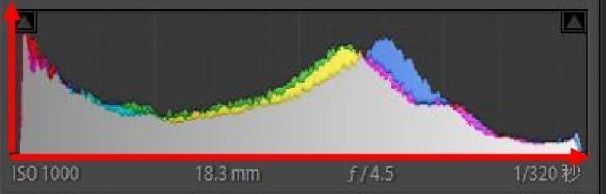
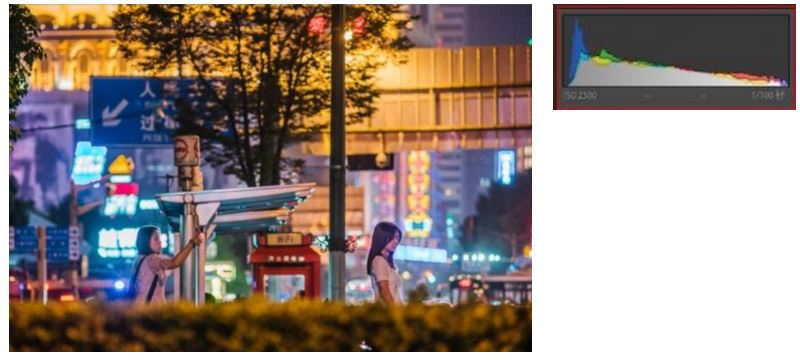
Like the photo below, although the blue channel is mostly in the dark tone, in terms of the overall color tone, the pixels in the histogram are distributed almost evenly in the respective brightness regions, so the hue in the corresponding picture is relatively rich.
When the pixels in the picture are mainly concentrated at the two ends of the picture, it means that there are many bright parts and dark parts in the picture, and a photo with both bright parts and dark parts means that the picture gives a feeling that the contrast is strong…
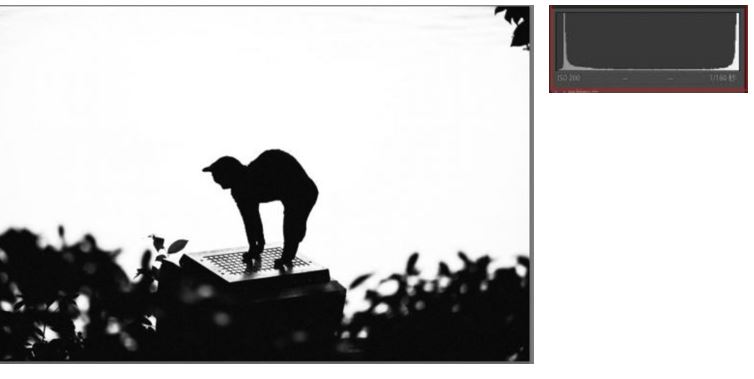
The pixel is strongly contrasted on both sides, so the reverse can be inferred that if the pixel is concentrated in the middle, the contrast will be small, and the contrast will be less. The overall impression of the photo will be gray.
![]()
Knowing this, we can control the exposure through the histogram when we shoot. If the pixels of the histogram in the photo are concentrated on the left side, the corresponding picture should belong to the dark tone photo. If the picture in front of you is not your subjective desire, take a dark tone, then say that the current exposure is insufficient, you need to increase the exposure. If the pixels in the histogram are concentrated on the right side, the corresponding picture should belong to a high-profile photo. Of course, if the picture in front of you is not subjectively wanting to take a high-profile picture, it means overexposure and needs to reduce the exposure.
However, it should be noted that the histogram is always an objective data for the photo itself. It does not reflect the subjective feelings brought by the photo, and each photo is different, so there must be different pixel distribution. It is good that we can’t ask the histogram to achieve what it is. It is most important to read the histogram and control the exposure according to your understanding of the picture.
Related Posts
SJCAM C300 Action Camera Review – Budget Alternative to GoPro
What we can expect from the upcoming GoPro Hero 10 Black
EZVIZ C6N Review: Smart Home camera with IR night vision
7 Best and Affordable Digital Cameras of 2020
What is Pill Camera Technology in the size of a capsule?
Why laptop cameras are not as good as smartphone cameras?