The dstat command is a tool for replacing commands such as vmstat, iostat, netstat, nfsstat, and ifstat. It is a versatile system information statistics tool. Compared with sysstat, dstat has a color interface. When you observe the performance status manually, the data is more conspicuous and easy to observe. Moreover, dstat supports instant refresh. For example, if you input dstat 3, it will be collected every three seconds, but the latest data will be refreshed every second. display.
How to install dstat on Redhat (Centos/ Fedora) and Debian (Ubuntu/Linux Mint) based systems?
For REHL (Centos/ Fedora)
yum install dstat
For Debian or Ubuntu or Linux Mint
sudo apt install dstat
Default Usage:
dstat
Directly use dstat, the default is to use the -cdngy parameter, which displays CPU, disk, net, page, and system information respectively. The default is 1s to display a message. You can specify the time interval for displaying a message at the end. For example, if dstat 5 is not displayed in 5s, dstat 5 10 means no 5s is displayed, and a total of 10 are displayed. as follows:

Usage with Vmstat
dstat -Vmstat

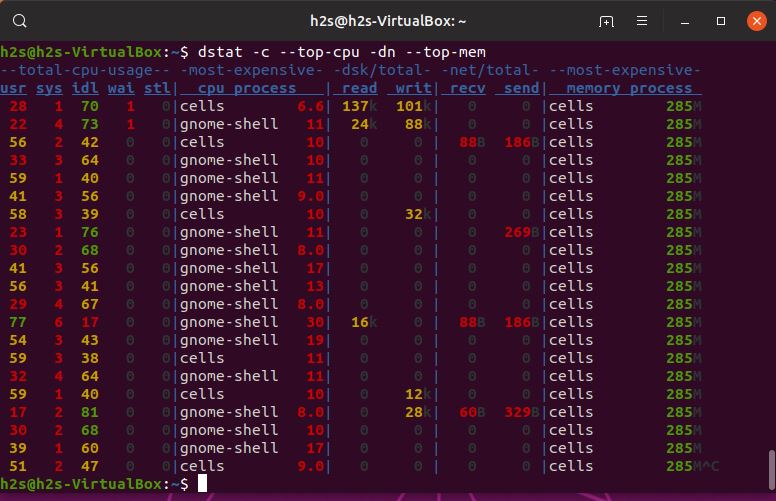
- -c : cpu usage
- –top-cpu : process using most CPU
- -dn : disk and network stats
- –top-mem : process consuming the most memory
Usage to know about CPU, Disk and Memory consumption
dstat -c --top-cpu -dn --top-mem
Furthermore, if we want, we can save the hardware performance information of the system in a CSV file for later evaluation purpose. For that just use the –output syntax at the last of the command followed by the number of counts you want to save.
For example, we want to monitor and save CPU, Memory, and the total load on Linux computer in a given period of time along with the command to save the same in a CSV file, from 1 to 6 counts.
dstat --time --cpu --mem --load --output report.csv 1 6

To get a list of all plugins used for dstat the command is:
dstat --list

All commands available for dstat:
dstat -h
Here is all the dstat command list:
Usage: dstat [-afv] [options..] [delay [count]]
Dstat options:
-c, --cpu enable cpu stats
-C 0,3,total include cpu0, cpu3 and total
-d, --disk enable disk stats
-D total,hda include hda and total
-g, --page enable page stats
-i, --int enable interrupt stats
-I 5,eth2 include int5 and interrupt used by eth2
-l, --load enable load stats
-m, --mem enable memory stats
-n, --net enable network stats
-N eth1,total include eth1 and total
-p, --proc enable process stats
-r, --io enable io stats (I/O requests completed)
-s, --swap enable swap stats
-S swap1,total include swap1 and total
-t, --time enable time/date output
-T, --epoch enable time counter (seconds since epoch)
-y, --sys enable system stats

--aio enable aio stats
--fs, --filesystem enable fs stats
--ipc enable ipc stats
--lock enable lock stats
--raw enable raw stats
--socket enable socket stats
--tcp enable tcp stats
--udp enable udp stats
--unix enable unix stats
--vm enable vm stats
--vm-adv enable advanced vm stats
--zones enable zoneinfo stats

--list list all available plugins
--plugin enable external plugin by name (see --list)

-a, --all equals -cdngy (default)
-f, --full automatically expand -C, -D, -I, -N and -S lists
-v, --vmstat equals -pmgdsc -D total

--bits force bits for values expressed in bytes
--float force float values on screen
--integer force integer values on screen

--bw, --black-on-white change colors for white background terminal
--color force colors
--nocolor disable colors
--noheaders disable repetitive headers
--noupdate disable intermediate updates
--output file write CSV output to file
--profile show profiling statistics when exiting dstat

delay is the delay in seconds between each update (default: 1)
count is the number of updates to display before exiting (default: unlimited)
Other default output syntax :
Procs
- r: the number of processes running and waiting (CPU time slice), this value can also determine whether it is necessary to increase the CPU (long-term is greater than 1)
- b: the number of processes in an uninterruptible state, the common situation is caused by IO
Memory
- Swpd: Switch to memory on swap memory (default is in KB). If the value of swpd is not 0, or it is still relatively large, such as more than 100M, but the value of si, so is long 0, we can not worry about this situation, it will not affect system performance.
- Free: free physical memory
- Buff: As the memory of the buffer cache, buffer the reading and writing of the block device.
- Cache: The memory of the page cache, the cache of the file system. If the value of the cache is large, it means that the number of files in the cache is large. If the frequently accessed files can be cached, the read IO bi of the disk will be very small.
Swap
- Si: swap memory usage, swapped into memory by disk
- So: swap memory usage, transferred from memory to disk
When the memory is sufficient, these two values are all 0. If these two values are longer than 0, the system performance will be affected. Both disk IO and CPU resources are consumed.
I found that some friends see that free memory (free) is very little or close to 0, it is considered that the memory is not enough, in fact, can not just look at this, but also combined with si, so, if free, but si, So is also very rare (mostly 0), so don’t worry, system performance will not be affected at this time.
Disk IO
- Bi: Total amount of data read from the block device (read disk) (KB/s)
- Bo: data prime (write disk) written to the block device (KB/s)
Note: When the random disk is read or written, the two values are larger (for example, beyond 1M), and the value that the CPU waits for IO will be larger.
System
- In: number of interrupts generated per second
- Cs: number of context switches generated per second
The larger the above two values, the more CPU time will be consumed by the kernel.
Cpu
- Usr: percentage of CPU time consumed by user processes
When the value of us is high, it means that the user process consumes more CPU time, but if it is used for more than 50% for a long time , then we should consider optimizing the algorithm or speeding up (such as PHP / Perl ).
- Sys: percentage of CPU time consumed by the kernel process
When the value of sys is high, it indicates that the system kernel consumes a lot of CPU resources. This is not a benign performance. We should check the reason.
- Wai: percentage of CPU time that IO waits to consume
When the value of wa is high, it indicates that the IO wait is more serious. This may be caused by a large number of random accesses to the disk, or it may be a bottleneck of the bandwidth of the disk (block operation).
- Idl: percentage of CPU idle time
Download the complete dstat command list pdf file from here.
Other Useful Resources:
Related Posts
Start command prompt as administrator in Windows 10/8/7
How to Check Windows 10 version using Command prompt
8 Best ways to start Command Prompt in Windows 10
How to show hidden files in Windows 10 using Command prompt
How to adjust the number of clock cycles for DOS programs and games running on DOSBox
Top 8 Wget commands to use while downloading files on Linux