Prometheus is a powerful system monitoring solution having a time-series database. Here in this tutorial, we learn how to install Prometheus on Debian 11 Bullseye Linux.
The key idea behind the implementation of Prometheus is to get an environment to have, dedicated monitoring, alerting, and trending system. In today’s world where companies are facing difficulties in configuring and controlling multiple systems; there Prometheus monitoring tool, with a universal configuration solution companies can independently program and also document the control code for the respective control technology (operating system, PLC, I / O level, etc.).
Key advantages of using Prometheus:
- Lowers the complexity of project planning
- Save time and effort by automating things
- Multiple modes for visualizing data.
- Built-in expression browser, Grafana integration, and a console template language.
- Allow bridging of third party data
- PromQL allows slicing and dicing of collected time-series data
- Alert System
- Prometheus records and documents the respective control strategies
- Comprehensive expertise is no longer required for implementation, commissioning, or deployment.
- All standards can be managed centrally, regardless of manufacturer and device type.
Steps to install Prometheus on Debian 11 Bullseye Linux
The steps giver here were performed on Debian 11 however can be used for Debian 10 Buster, Ubuntu 20.04, or 22.04 Linux.
1. Add a new system user
Instead of installing Prometheus under our current user, we create a new system user to limit some rights.
Let’s first add a group called Prometheus:
sudo groupadd --system prometheus
Now, add a user and assign it to the group created above with no login rights.
sudo useradd -s /sbin/nologin --system -g prometheus prometheus
2. Create a user directory for Prometheus
Create some folders where we will save the files required to run Prometheus.
sudo mkdir /etc/prometheus
sudo mkdir /var/lib/prometheus
3. Download Prometheus Monitoring for Debian 11
Apart from the easy-to-use Docker installation, Prometheus binary is also available in archive format to download and install to use on Debian or other Linux. For the latest version, the user can visit its website download page. or use the command line method:
curl -s https://api.github.com/repos/prometheus/prometheus/releases/latest|grep browser_download_url|grep linux-amd64|cut -d '"' -f 4|wget -qi -
Once the file is on your system, extract it:
Note: Replace the Prometheus-2.32.1.linux-amd64 file with the version you have downloaded.
To list all files in the current directory:
ls
tar -xvf prometheus-2.32.1.linux-amd64.tar.gz
Move the extracted files to the directory we have created:
sudo mv prometheus-2.32.1.linux-amd64 /etc/prometheus
Now give directories permission to the created Prometheus user:
sudo chown prometheus:prometheus /etc/prometheus
sudo chown prometheus:prometheus /var/lib/prometheus
sudo chown -R prometheus:prometheus /etc/prometheus/consoles
sudo chown -R prometheus:prometheus /etc/prometheus/console_libraries
4. Configure Prometheus files and script
Let’s configure some of its scripts and tools by copying them in the bin directory of the system user.
sudo cp /etc/prometheus/prometheus /usr/local/bin/
sudo cp /etc/prometheus/promtool /usr/local/bin/
5. Install Prometheus Systemd Service on Debian 11
Once the all above setup and configuration are done for setting up Prometheus on Debian or Ubuntu, let’s create a Systemd service file for this Monitoring tool, so that it can start and run automatically in the background as a system service.
Create a file, if nano is not then you can get it –sudo apt install nano -y
sudo nano /etc/systemd/system/prometheus.service
Copy-paste the given lines in the file:
[Unit]
Description=Prometheus
Documentation=https://prometheus.io/docs/introduction/overview/
Wants=network-online.target
After=network-online.target
[Service]
User=prometheus
Group=prometheus
Type=simple
ExecStart=/usr/local/bin/prometheus \
--config.file /etc/prometheus/prometheus.yml \
--storage.tsdb.path /var/lib/prometheus/ \
--web.console.templates=/etc/prometheus/consoles \
--web.console.libraries=/etc/prometheus/console_libraries

[Install]
WantedBy=multi-user.target
Save the file by pressing Ctrl+O, hit the Enter key, and then use Ctrl+X to exit the file.
6. Start and enable Prometheus
Once the service file is created, let’s start the service in the background also make it enable to let it run automatically with system boot or when it gets crashed.
sudo systemctl daemon-reload
sudo systemctl enable --now prometheus
Check the status of service:
systemctl status prometheus

7. Access web interface
As we have confirmed that the service of this monitoring service is successfully running on our system, let’s access its web interface.
Open any browser that can access the IP address of Debian 11 or any other similar Linux server you are using.
Point to http://server-ip-address:9090
Note: Replace, server-ip-addresswith the actual Ip-address of your Server. Also, make sure the 9090 is open in the firewall:
sudo ufw allow 9090
8. Search metric and find Graph
After following the previous steps you would already have the Web interface of Prometheus. Now, in the search box type the “metrics” you want to search for. Know more about it at official Documentation.

9. How to install Node_exporter Prometheus on Linux
Monitor other Linux system hardware by setting up Prometheus Node Exporter on them.
Well, so far we have only installed the server, whereas to get the metrics from other target systems we have to declare their IP address in the prometheus.yml file to get the metrics from the source systems. We see that later here.
Let’s say we have Five systems in the network to monitor.
First, install Node_Exporter in all five Linux systems you want to monitor by sending their metrics to the Prometheus server. Where, Node Exporter is meant for exporting machine metrics in the same way other exporters are available for servers running with MySQL, haproxy_exporter, graphite_exporter, and more.
Therefore, we need to set up Node_Exporter to collect the metrics using the given commands; it will be the same for all Linux whether is RPM or Debian-based.
1. Download Node Exporter
curl -s https://api.github.com/repos/prometheus/node_exporter/releases/latest| grep browser_download_url|grep linux-amd64|cut -d '"' -f 4|wget -qi -
2. Extract the downloaded file:
tar -xvf node_exporter-*.linux-amd64.tar.gz
3. Move the Node exporter service file to bin:
sudo mv node_exporter-*.linux-amd64/node_exporter /usr/local/bin/
4. Create a user to run the Node Exporter service
sudo useradd -rs /bin/false node_exporter
5. Create Systemd service file:
To run the Node exporter as a background system service, create a service file:
sudo nano /etc/systemd/system/node_exporter.service
Copy and paste the following lines:
[Unit]
Description=Node Exporter
After=network.target

[Service]
User=node_exporter
Group=node_exporter
Type=simple
ExecStart=/usr/local/bin/node_exporter

[Install]
WantedBy=multi-user.target
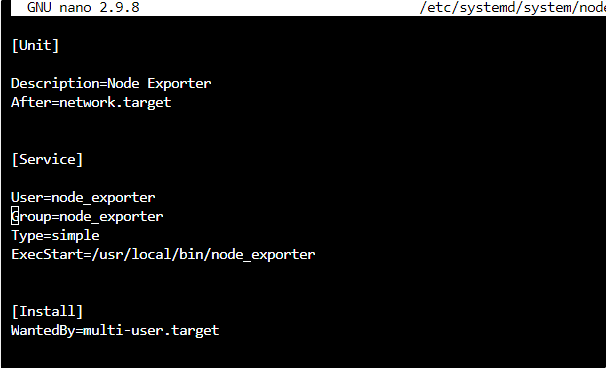
Save the file- Ctrl+O hit the Enter key, and exit – Ctrl+X.
Note: If you are on RedHat, AlmaLinux, Rocky Linux, or another similar one as Target machine to scrap metrics, then first set SELinux to permissive mode.
sudo setenforce permissive
6. Start and enable the service
Now, let make it run in the background:
sudo systemctl daemon-reload
sudo systemctl enable --now node_exporter
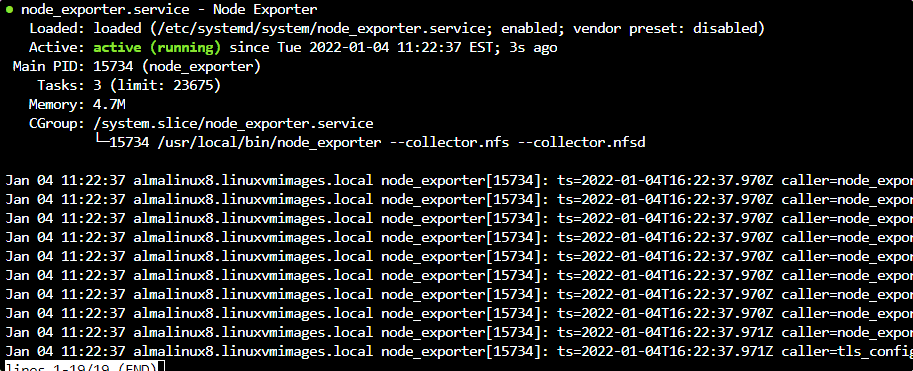
Check Status:
systemctl status node_exporter
7. Open port 9100 in the firewall
1. For Debian or Ubuntu
sudo ufw allow 9100
2. F0r Redhat, AlmaLinux, Rocky Linux, and other RPM-based systems:
sudo firewall-cmd --zone=public --add-port=9100/tcp --permanent
sudo firewall-cmd --reload
7. Add Target machine Ip-address in the prometheus.yml Server
Now, again access your Debian or Ubuntu server running the Prometheus server command line and edit its YML file.
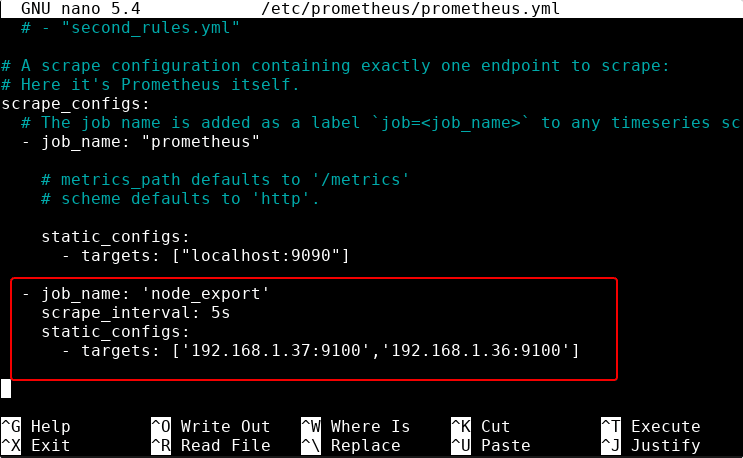
Let’s say you have five systems to monitor using Prometheus then edit its YML file that is:
sudo nano /etc/prometheus/prometheus.yml
And the end of the file add
- job_name: 'node_exporter_metrics'
   scrape_interval: 5s
   static_configs:
     - targets: ['192.168.1.37:9100','192.168.1.36:9100','192.168.1.37:9100']
In the Targets, add the IP addresses in the given format of machines that you want to monitor.
Save the file by pressing Ctrl+O, hit the Enter, to exit Ctrl+X.
1. Check Prometheus YMKL is valid or not
Now to confirm whether the YML file we have edited is valid without any syntax errors.
promtool check config /etc/prometheus/prometheus.yml

2. Restart Prometheus Server
sudo systemctl restart prometheus
Also, don’t forget to check the service status:
systemctl status prometheus
8. Monitor target machine in Prometheus web UI
Go to the web interface, for that again open the browser and point it to http:server-ip-adderess:9090/targets
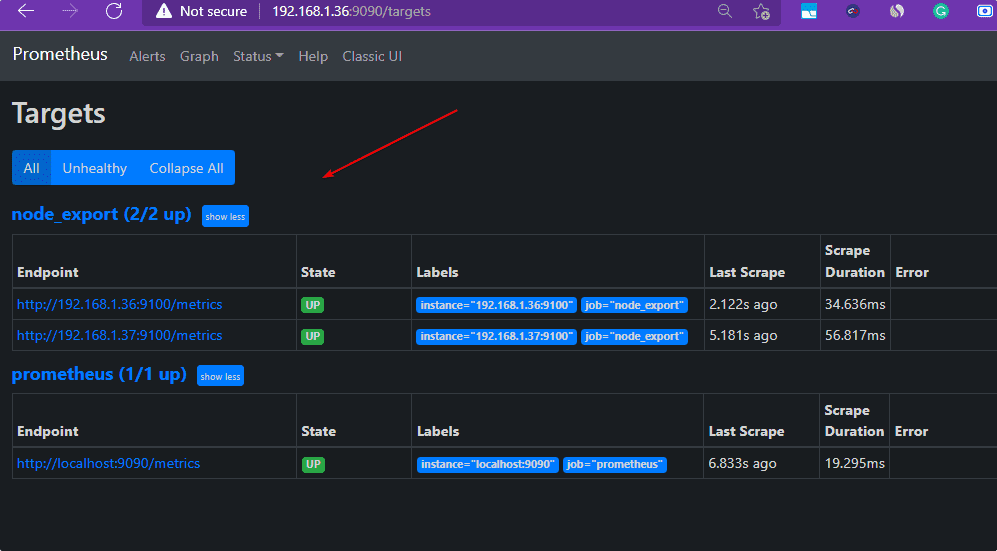
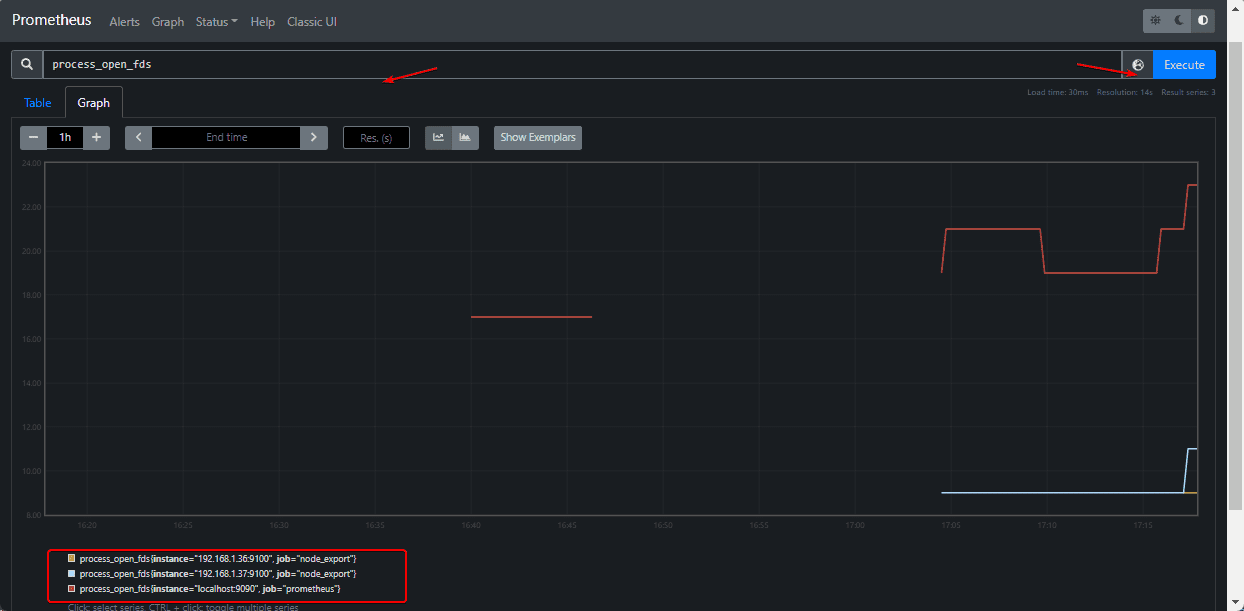
Now, you can start monitoring and scraping metrics from all the added Target Linux machines. So, this was the quick tutorial on setting up the Prometheus server on Debian 11 bullseye along with Target machines to fetch metrics data.

Other Articles:
• 7 Best Gnome system monitor alternative Linux applications
• 5 Best htop alternatives to monitor Linux systems
