Here we will see the steps to install Sysdig, a Linux system or server monitoring tool on CentOS, Redhat, Debian Ubuntu 20.04/18.04/16.04 along with other non-LTS versions including Linux Mint and Elementary OS.
What is the Sysdig Linux monitoring tool?
Sysdig is an open-source alternative tool to top, iotop, iftop, strace, tcpdump, htop, iftop, lsof, and transaction tracing. It provides a complete overview of the usage of CPU, Memory, IO, users, and more directly on the command terminal in a well-structured interface. Sysdig can be installed on almost all operating systems, even on Windows and OS X.
requirements
- Ubuntu server or desktop
- To execute all commands in this tutorial one should have root user access or a non-root user with sudo rights.
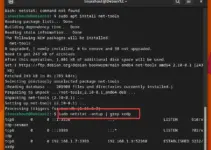
Step 1: Update the system
Run the system update command to ensure all the repository and other installed packages are in their latest state.
sudo apt update
Step 2: Install Sysdig on various Linux system
Ubuntu
In the latest operating system of Ubuntu and Linux Mint, we don’t need to add any repository and can install Sysdig using just one single command i.e.
sudo apt install sysdig
However, in Debian and other Linux distros based on it, run the below script which will not only add its repo but also install the Sysdig.
Before the script, running the command to install curl and other software-common-properties helps the APT to manage software from different sources efficiently.
sudo apt -y install software-properties-common curlcurl -s https://s3.amazonaws.com/download.draios.com/DRAIOS-GPG-KEY.public | gpg --dearmor | sudo tee /usr/share/keyrings/DRAIOS-GPG-KEY.gpgecho 'deb [signed-by=/usr/share/keyrings/DRAIOS-GPG-KEY.gpg] https://download.sysdig.com/stable/deb stable-$(ARCH)/' | sudo tee /etc/apt/sources.list.d//draios.listThe installation is fully automated and requires no further intervention.
Sysdig install on CentOS, RHEL, Fedora, Amazon Linux
Add the Yum repository
sudo rpm --import https://s3.amazonaws.com/download.draios.com/DRAIOS-GPG-KEY.public
sudo curl -s -o /etc/yum.repos.d/draios.repo https://s3.amazonaws.com/download.draios.com/stable/rpm/draios.repo
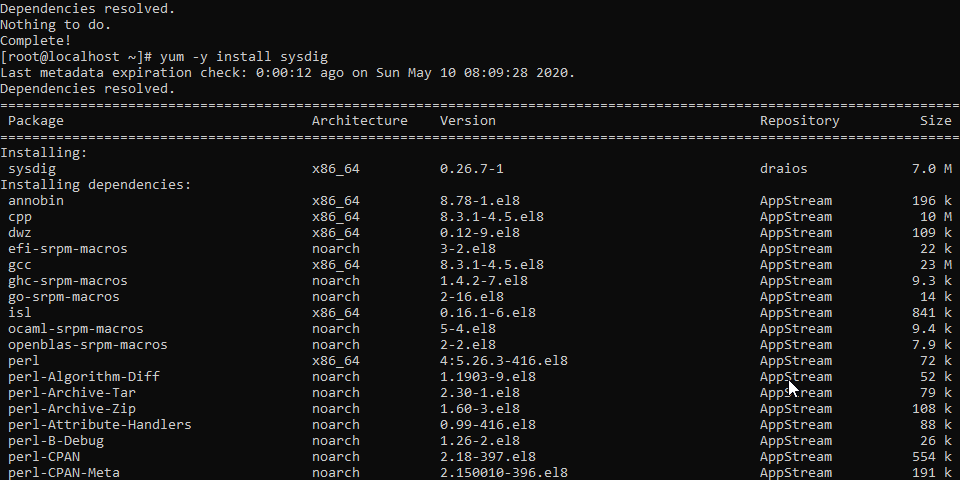
sudo yum -y install sysdig
or
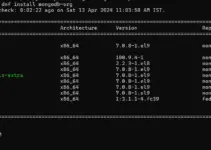
sudo dnf -y install sysdig
Docker Sysdig Installation
docker pull sysdig/sysdig
docker run -i -t --name sysdig --privileged -v /var/run/docker.sock:/host/var/run/docker.sock -v /dev:/host/dev -v /proc:/host/proc:ro -v /boot:/host/boot:ro -v /lib/modules:/host/lib/modules:ro -v /usr:/host/usr:ro sysdig/sysdig
Step 3: How to use Sysdig commands
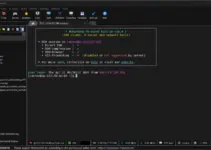
The first simple command of Sysdig to view the running process, consumption of memory by them, and more; simply type:
sudo csysdig
We are running it with sudo because Sysdig needs to access some crucial areas of the system such as /proc file system, /dev/sysdig* devices, and more to provide you with the current load and other information.
Something like the below output you will see…
PID: Process PID.
CPU: Amount of CPU used by the process.
TH: Number of threads that the process contains.
VIRT: Total virtual memory for the process.
RES: Resident’s non-swapped memory for the process.
FILE: Total (input+output) file I/O bandwidth generated by the process, in bytes per second.
NET: Total (input+output) network I/O bandwidth generated by the process, in bytes per second.
Command: The full command line of the process
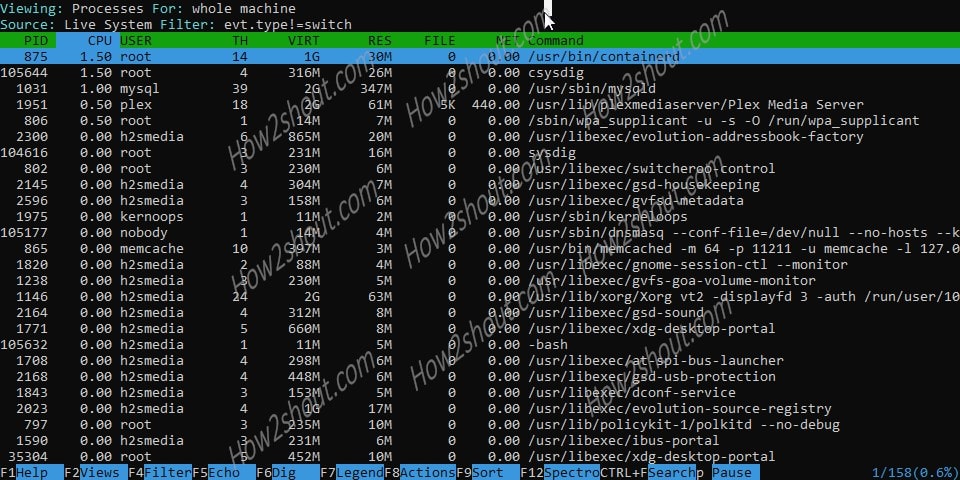
In the above screenshot, you can see the currently running processes, command, and their impact on system utilization (CPU and Memory load). The menu or key assignment is located at the bottom. Pressing F2 will bring up another menu, here you can choose what you want to look at.
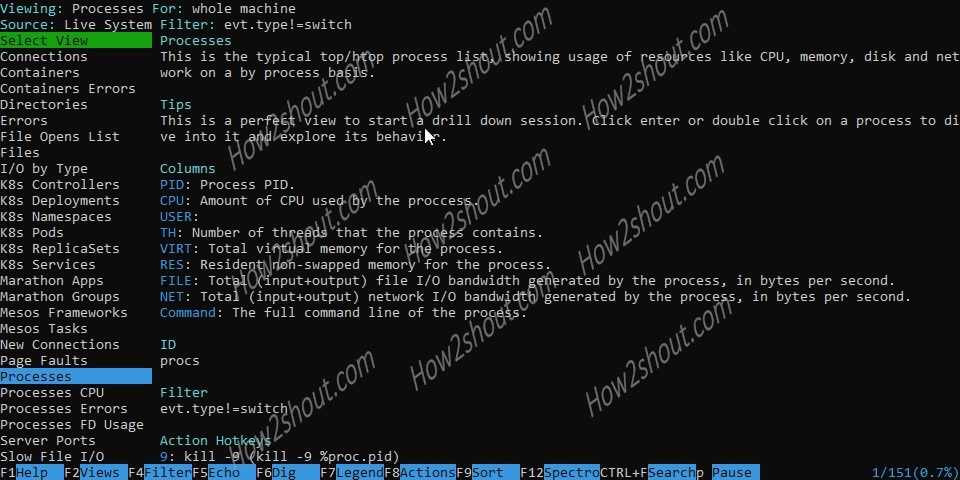
You can see in the above screenshot the key things that we need to monitor are showing on the left side panel in the Command terminal. With the arrow keys, you can choose what interests you and then hit the Enter key which will switch the interface to the corresponding filter.
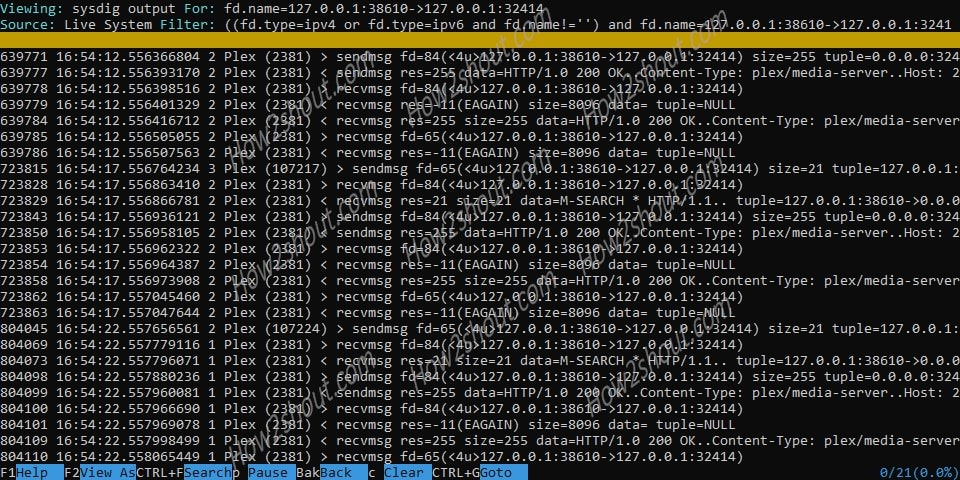
For example, to test the connections we have selected that and the following shown.

This shows you which connections are currently connected to the server, for example, active SSH sessions along with the plex media server. If you want to dig more to deep to know more about it, press F6.
In the same way, selecting the Errors option will show all processes that have failed. They are sorted according to the frequency in which they occur.
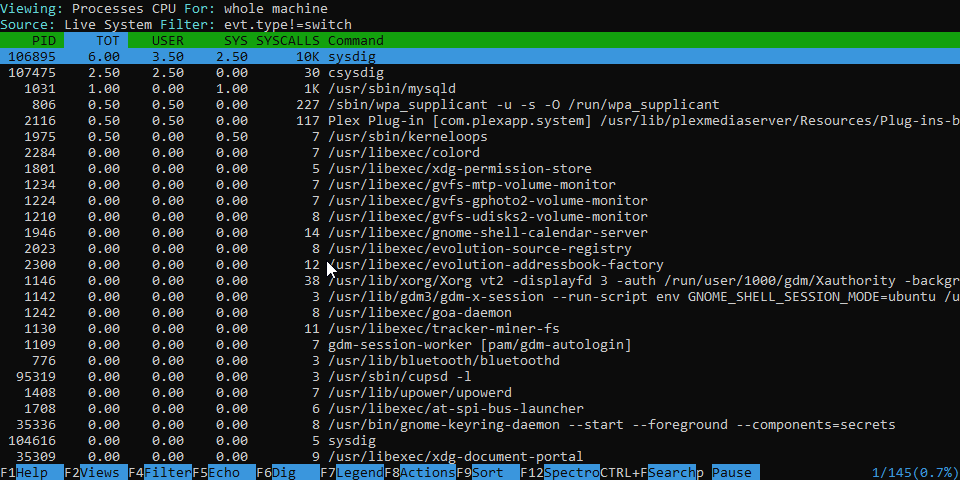
To know about the process and total CPU used by them, select the “Process CPU” option and hit the Enter Key.
PID: Process PID.
TOT: Total amount of CPU used by the process (user + system).
USER: Amount of user CPU used by the process.
SYS: Amount of system CPU used by the process.
SYSCALLS: Number of system calls per second made by the process.
Command: The full command line of the process.
Under File Opens List, for example, you will find a list of all files that are currently being accessed and who or which program is accessing them.
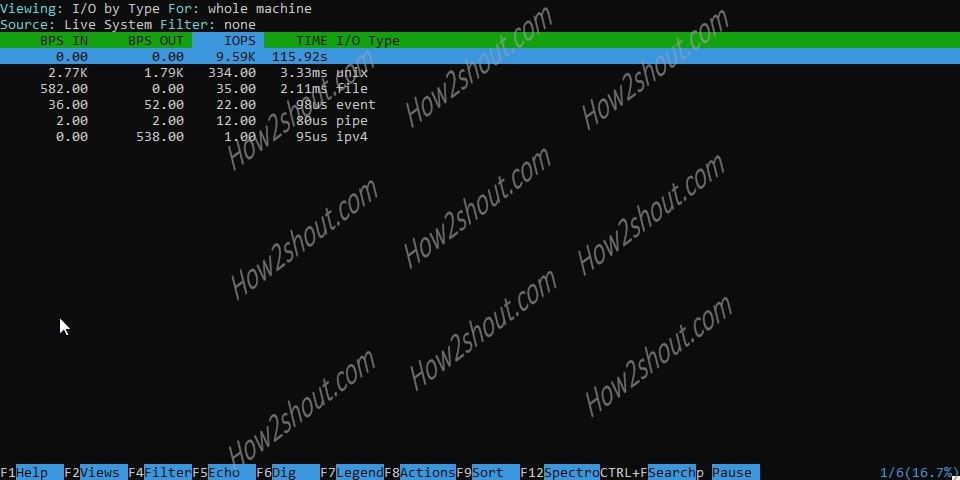
I / O by Type: shows you which process, or which trigger is currently writing and reading how much on the data medium. This is about the transfer rate, the total number of data moved cannot be viewed here.
BPS IN: Bytes per second read from the FDs of the specific type.
BPS OUT: Bytes per second written to the FDs of the specific type.
IOPS: Number of I/O operations for the specified I/O category. This counts all the operations on the file, including, open, close, read, write, stat, and so on. As a consequence, this value can be nonK8s Services zero even if I/O bytes for the file are zero.
TIME: Time spent by processes doing any I/O operation (including wait) of this type.
I/O Type: Type of I/O. Can be one of the file, directory, ipv4, ipv6, pipe, Unix, signal, event, inotifMesos Frameworks y
Under Spy Users, you will find a list of all processes that have been called by users – not the system or other processes. Here you can see the lists all the commands that are run interactively, i.e. that have a shell as the parent process. The Files result is the display of all the user activity, sorted by time.
TIME: Time when the command was executed.
USER: Name of the user running the command.
SHELL: Pid of the shell where this command was executed. This, essentially, corresponds to a ‘session ID’. You can filter or sort by this column to isolate a specific interactive user session.
Command: The executed command, including arguments.
Similarly, we can explore other options to monitor our Linux systems.
If you want to get some particular details of the system such as CPU, Network, and more, you can also use the direct command corresponding to that. As in the pure Commandline version, there are so many settings, variables, and filters that I don’t want to list them all here. You can find a complete list of all functions in the official Sysdig Wiki.
Here are few of those:
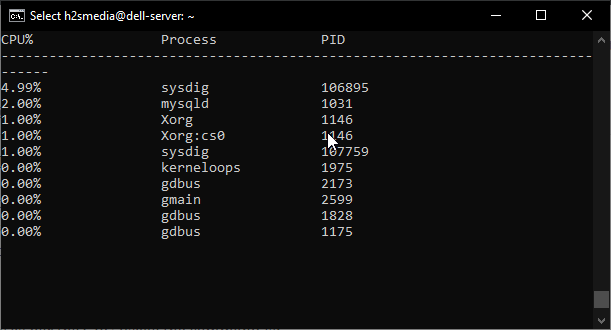
To directly monitor the process as per the CPU usage the command is:
sudo sysdig -c topprocs_cpu
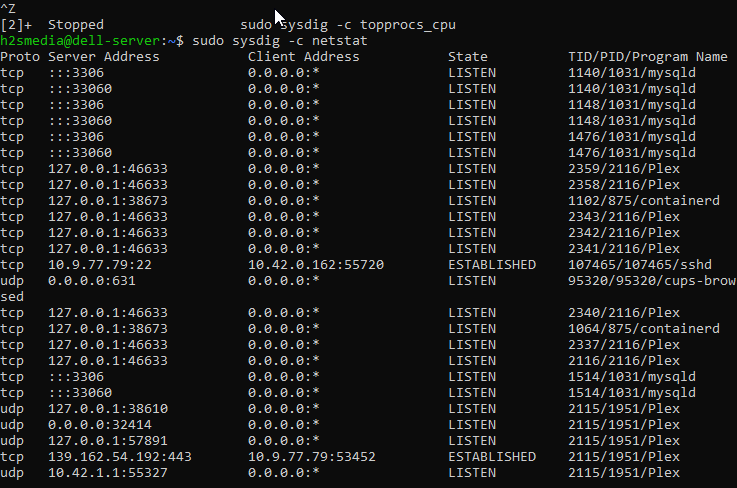
The command to Monitor both network connections
sudo sysdig -c netstat
To see top network connections and process by network Input/Output
sudo sysdig -c topconns
sudo sysdig -c topprocs_net
Other quick commands can be seen using the command:
sudo sysdig -cl
Following are the commands as per category:
For example, I want to see the HTTP request log, the first command given in the below list. To use that, simply type
sudo sysdig -c httplog
The one in bold is the command…
Category: Application
---------------------
httplog HTTP requests log
httptop Top HTTP requests
memcachelog memcached requests log

Category: CPU Usage
-------------------
spectrogram Visualize OS latency in real time.
subsecoffset Visualize subsecond offset execution time.
topcontainers_cpu Top containers by CPU usage
topprocs_cpu Top processes by CPU usage

Category: Errors
----------------
topcontainers_error Top containers by number of errors
topfiles_errors Top files by number of errors
topprocs_errors top processes by number of errors

Category: I/O
-------------
echo_fds        Print the data read and written by processes.
fdbytes_by        I/O bytes, aggregated by an arbitrary filter field
fdcount_by       FD count, aggregated by an arbitrary filter field
fdtime_by        FD time group by
iobytes             Sum of I/O bytes on any type of FD
iobytes_file      Sum of file I/O bytes
spy_file             Echo any read/write made by any process to all files. Optionally, you can provide the name of one file to only intercept reads
/writes to that file.
stderr        Print stderr of processes
stdin          Print stdin of processes
stdout             Print stdout of processes
topcontainers_file               Top containers by R+W disk bytes
topfiles_bytes                  Top files by R+W bytes
topfiles_time              Top files by time
topprocs_file                Top processes by R+W disk bytes
udp_extract                 extract data from UDP streams to files.

Category: Logs
--------------
spy_logs                   Echo any write made by any process to a log file. Optionally, export  the events around each log message to file.
spy_syslog                     Print every message written to syslog. Optionally, export the events around each syslog message to file.

Category: Misc
--------------
around                  Export to file the events around the time range where the given filter matches.

Category: Net
-------------
iobytes_net    Show total network I/O bytes
spy_ip            Show the data exchanged with the given IP address
spy_port        Show the data exchanged using the given IP port number
topconns         Top network connections by total bytes
topcontainers_net   Top containers by network I/O
topports_server     Top TCP/UDP server ports by R+W bytes
topprocs_net        Top processes by network I/O

Category: Performance
---------------------
bottlenecks             Slowest system calls
fileslower               Trace slow file I/O
netlower               Trace slow network I/0
proc_exec_time              Show process execution time
scallslower               Trace slow syscalls
topscalls                Top system calls by number of calls
topscalls_time             Top system calls by time

Category: Security
------------------
list_login_shells    List the login shell IDs
shellshock_detect     print shellshock attacks
spy_users             Display interactive user activity

Category: System State
----------------------
lscontainers                                 List the running containers
lsof                                     List (and optionally filter) the open file descriptors.
netstat                               List (and optionally filter) network connections.
ps                                List (and optionally filter) the machine processes.

Category: Tracers
-----------------
tracers_2_statsd        Export spans duration as statds metrics.

Use the -i flag to get detailed information about a specific chisel
To know all related commands and other information with an example for sysdig and csysdig tools you can see their man page:
man sysdig
man csysdig
Ending Notes for Sysdig
Sysdig is a very extensive tool to keep track of the current status and load of your system. While Csysdig, Sysdig offers you a comfortable command-line-based interactive interface within the console to work effectively. You can build effective scripts and create your custom log files using the command line tool itself.
Other Linux Tutorials: