In the field of Data, Science data plays a big role because everything that we do is centered around the data only. Companies are hiring specialized people to handle their data, and the employability in this sector is increasing very rapidly. The reason for the success of this field is because of the incorporation of certain tools for data handling, and these are mainly programming languages, data visualization tools, database management tools.
With the help of these things, it has become easy to deal with any kind of data as well as storing it in a safer place. With such advancements taking place one thing to note is that any mistake made while handling these huge datasets leads to complete failure of the project in which a company is working. The employee must satisfy the needs of the employer by giving him/her meaningful insights into the data and not any kind of trash. As mentioned that with the help of programming languages data handling has become very easy this is because these programming languages give the liberty to Data Scientists to play around with their data and tweak the same to get different outputs and then select the best one. One such programming language is Python. It is a potent and most preferred language out there to perform Data Science related activities.
Talking about the data then the data we use must be properly cleaned that is not containing any kind of suspicious points which may lead to poor performance. These suspicious points are called Outliers, and it is essential to remove these outliers if the company wants. So let’s take a look at how to remove these outliers using Python Programming Language:
Outlier Removal
An outlier can be termed as a point in the dataset which is far away from other points that are distant from the others. So, how to remove it? Here you will find all the answers.
Visualizing the Outlier
To visualize the outliers in a dataset we can use various plots like Box plots and Scatter plots. The box plot tells us the quartile grouping of the data that is; it gives the grouping of the data based on percentiles. If the points fall within the quartile range then they are used for analysis and if they fall outside the range then they are termed as outliers and removed from the dataset. Box plots can be used on individual points and this is called univariate analysis. Also, if we have one categorical variable and the other continuous then also we can use the Box plot and this is termed multivariate analysis.
A pictorial representation of Box plot is given below:

Scatter plots are the type of plots that are mainly used for bivariate analysis as we need an X and Y coordinate where we will be comparing the different variables with one another. This type of plot helps in detecting outliers by identifying the points that are far away from all the points i.e. if say maximum points are centered towards the left region of the graph and one or two are towards the right side of the graph then these two points will be the outliers.
A pictorial representation of the Scatter plot is given below:

Removing the Outlier
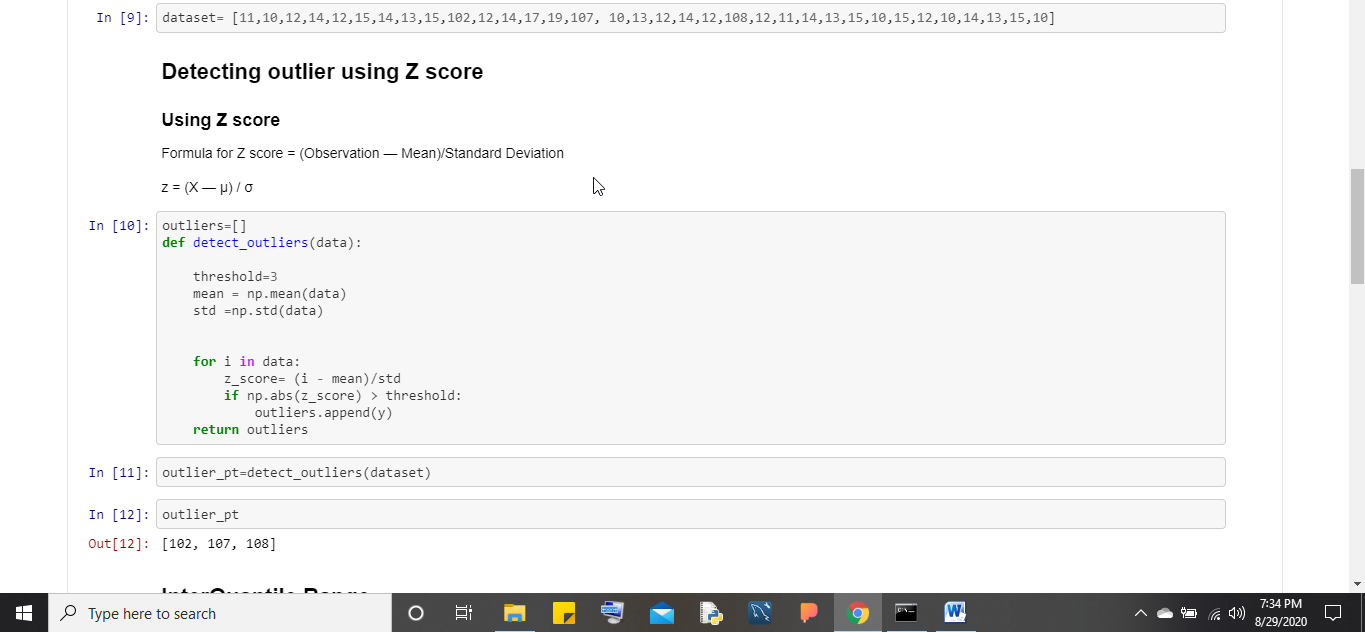
- Using the Z score: This is one of the ways of removing the outliers from the dataset. The principle behind this approach is creating a standard normal distribution of the variables and then checking if the points fall under the standard deviation of +-3. If the values lie outside this range then these are called outliers and are removed. The implementation of this operation is given below using Python:


- Using Percentile/Quartile: This is another method of detecting outliers in the dataset. Here we use the box plots to visualize the data and then we find the 25th and 75th percentile values of the dataset. Once this is done we find the Interquartile Score by subtracting the 5th percentile value from the 25th percentile and then find the lower and upper bounds of the data by multiplying the same with 1.5. Any point lying away from the lower and upper bound is termed as an outlier. The implementation of this operation is given below using Python:

Conclusion
It depends upon the interest of the organization whether they want to keep the outliers or remove them. We must know these steps and if any question is given to us where we need to remove outliers and then carry out Machine learning or any other activity then we should be able to do the same.
Related Posts
How to create email groups in Gmail? Send one email to multiple recipients in a matter of seconds.
Getting the right dashcam for your needs. All that you need to know
How to Install 7-Zip on Windows 11 or 10 with Single Command
How to Install ASK CLI on Windows 11 or 10
How do you install FlutterFire CLI on Windows 11 or 10?
How to create QR codes on Google Sheets for URLs or any other text elements