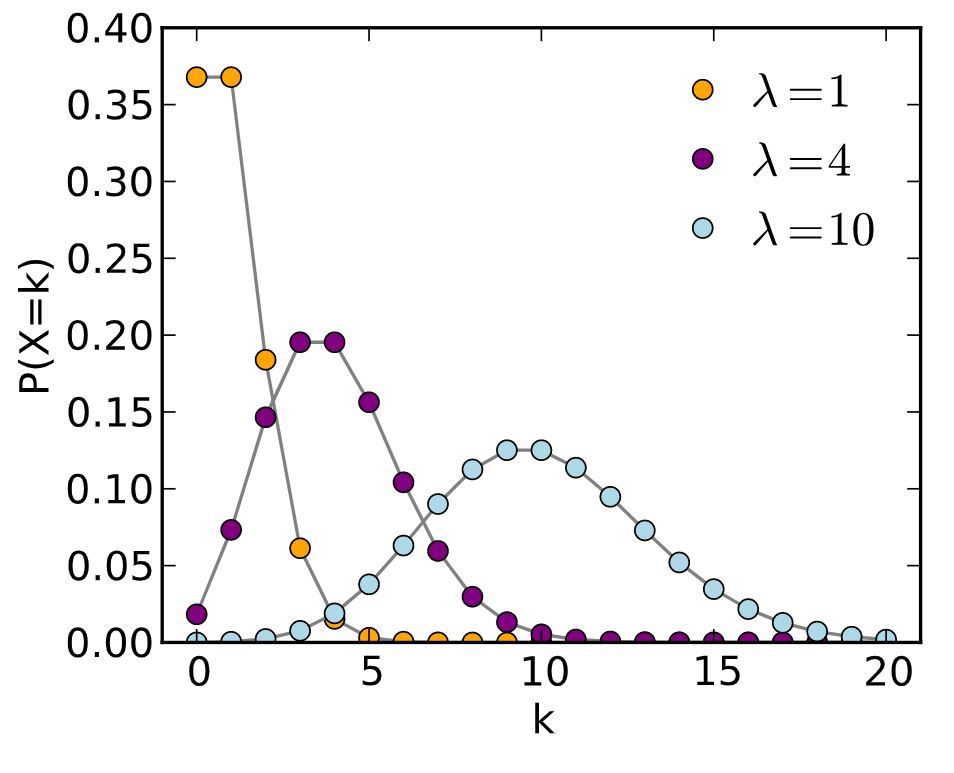
In the field of Data Science, it is a necessity to learn the concepts of Statistics and Probability because without it we cannot carry out the simplest operations as well. We need to think at every point of time which Statistical equation to fit in to make our work easier and presentable in front of the public. Probability and Statistics not only play a pivotal in Data Science but also in our day to day life like estimating the cost of a product, flipping a coin, playing cards, and estimating the probability of getting an Ace of Diamonds, etc. So these two terms are connected somehow with us.
Now, for a Data Scientist, it is of utmost importance to play around the database provided to him and help guide any organization to gain meaningful insights from the database by either plotting graphs, making interactive dashboards, or many more. Also, Probability plays an important role in getting the details of the data and how the data is distributed. There are numerous ways of getting the distribution of our data with the help of Probability and are termed Probability distributions. Some probability distributions are Binomial Distribution, Normal Distribution, Standard Normal Distribution, Poisson Distribution, etc. Today the heat of the topic is centered around Poisson Distribution. So, let’s take a deep dive and understand the meaning of this term:
Description
The Poisson distribution is a type of Probability Distribution that closely resembles the Binomial Distribution that is it is applied to a discrete random variable having some values. It is employed in describing random events that occur rarely over a continuum of space or time. For example, suppose we have an event A and we are concerned with determining the number of occurrences of event A at a particular period t then we will apply Poisson distribution. Here the time can be split into n equal intervals each having the length of t/n. These n intervals are also called Bernoulli trials.
Now the problem arises while calculating the probability of the event because the intervals in which the time is split has very less value and therefore we cannot apply Poisson Distribution as we cannot say that once the event occurred at a particular interval of time cannot occur again in that time.
So, to overcome this problem we increase the length of the time interval as far as possible such that the event fails to repeat itself in that period of time. The formula for calculating the Probability Mass Function for Poisson distribution is given by:
P(x) = e-m.mx / x!, where e is called the Naperian base having a value of 2.183, x is the no. of times the event occurs, and m is the mean of the random variable given by m= n.p (number of trials . probability of success).
The value of e-m can be obtained from mathematical tables. Also, one major thing to note here is that Poisson distribution never takes the probability of failure that is, 1-p = q into account so, if here we are only concerned with the success and the mean of the dataset. Also, the mean and the variance in the Poisson distribution are equal and given by the same formula.
Conclusion
By above we can conclude that whenever we are concerned with finding the probability of time-dependent data then we can apply Poisson distribution and that also when we can divide the no. of intervals into pretty large values. Also, Poisson distribution plays a very important role whenever we want to carry out Exploratory Data Analysis in Data Science using different tools like Python, R, Scala, etc.

Related Posts
Download & install npm and node.js packages on Windows 11 |10
How to Log your Errors in Python using Sentry?
How to Download Big Data for Data Science Projects Free of Cost
4 Most Popular Code Editors for developers
9 Best coding editors for Windows 10 or 11 in 2021
Best 5 Books to Learn Python Programming?