For carrying out Data Science related work involving Machine Learning, Deep Learning we need to know the in-depth concepts of how these work and how one single algorithm can carry out such a large operation. These algorithms are built by carrying out years of research and analysis and then are made available to users to use the same in their codes.
Now as a Data Scientist it is very much important to have sound technical knowledge related to coding and also knowledge regarding statistics and probability because every algorithm that we use to carry out operations is built using the concepts of statistics and probability. Moreover, we can say that if we are experts in stats then Data Science is a very easy task for us. Any Machine Learning algorithm whether Decision Tree, Random Forest, Linear Regression, etc. are built using some or the other kind of statistical formula that we have studied in school and colleges.
To be a successful Data Scientist it is, therefore, a necessity to learn these statistics and concepts of probability. Here we will be discussing the basic statistics that we should know if we are stepping towards the field of Data Science and are very much interested in Data Visualization and Data Preprocessing related activities:
- Population and Sample: These are the most basic terminologies that one should know of. The population is defined as the total amount of data contained whereas the sample is defined as a subset of the population when we pick particular data points from the total data. The population is denoted by “N” whereas the sample is denoted by “n”.
- Frequency Distribution: This is the base of any statistical problem when we are dealing with data classification. When we talk about classification then it is done according to the type of data (measurable data or attribute). For attribute type of data, we group the items based on similar characteristics and then put them in appropriate categories whereas in the case of measurable data it is classified according to classes. This sorting and segregation of data based on classes lead to the formation of frequency distributions. It helps us in providing the number of times a class occurred in the data. It is denoted by the letter “f” and the class by “x”. For constructing a frequency distribution table we generally use Yule’s formula that is 2.5 X n1/4. Here n is the total number of observations and after finding the classes we generally find the class interval in which we want our data to lie. This is given by the formula C= Maximum value – Minimum value / Number of classes. There are other types of frequency distributions also available like the cumulative frequency distribution which the total frequency up to and including that particular class as well.
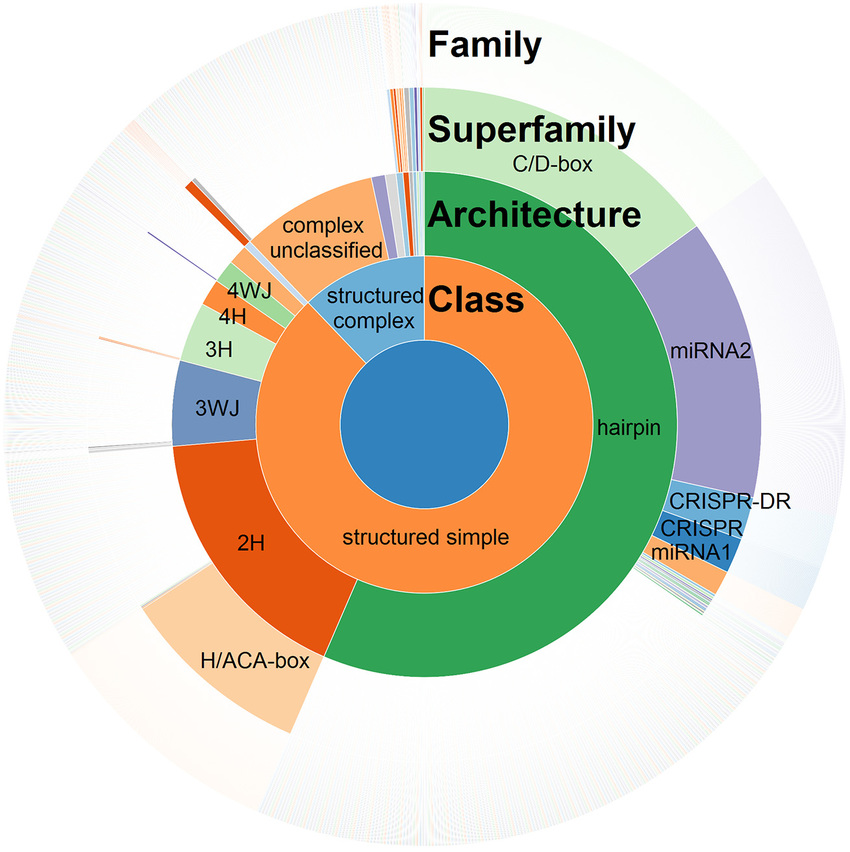
- Plotting Graphs: This is another statistical necessity one should learn to be a good Data Scientist because it is very much necessary to properly visualize our data and see the fluctuations present in it and generate necessary inferences from the same. The various kinds of graphs that are used by Data Scientists include Bar Graphs, Scatter Plots, Line Plots, Histograms, Box Plots, Pie Plots, and Sunburst plots, etc.

- Central Tendency Measures: This comprises computing the Mean, Median, and Mode of the data. The Mean tells us the average, Mode the highest number of occurrence of a particular data point, and the Median the mid-value of the data. The formula for these measures of central tendencies are:
Mean => x= ∑fx/n and, A + [∑fd/n X c], where f= frequency, A= Assumed mean, d= (x-A_/c, x= mid class value, c= class interval, n= total number of observations.
Mode => l + (fs/fp + fs X c), where l= lower limit of the mode class, fp= frequency value of the preceding modal class, fs= frequency value of the succeeding modal class and c= class interval.
Median => (n+1/2) and l + [(n/2)-cf/f X C], where l= lower limit of median classs, n= total number of observations, cf= cumulative frequency, f= frequency of median class, C= class interval.
- Dispersion: This is the measure of the spread of the data around the mean and is of different types like Mean Deviation, Standard Deviation, Coefficient of Variation, and Variance.

- Skewness: This is a measure to see the distribution of data around the mean that is, it tells us how symmetric our data is based on the frequency distribution plotted. The symmetrical distribution will have mean=mode=median and therefore have no skew.
There are many more statistical things that one should be aware of while carrying out Data Science and Machine Learning related activities like Kurtosis, Gaussian Distribution, Standard Normal Distribution, Binomial Distribution, etc. For better understanding, you can go through the statistical textbooks as well as online lectures and clear your concepts. This will help you become a good Data Scientist.
Conclusion
Before diving into the field of Data Science and Analytics please make sure that you are sound with the basics and can solve real-world cases by yourself. So start your journey as a Data Scientist and impart your knowledge to the world.

Related Posts
AirGo Vision- Solos’ Smart Glasses with AI Integration from ChatGPT, Gemini, and Claude
Rise of deepfake technology. How is it impacting society?
OpenAI’s Critic GPT- The New Standard for GPT- 4 Evaluation and Improvement
Claude 3.5 Takes the Lead- Why It’s Better Than GPT-4
Smartphone Apps Get Smarter- Meta AI’s Integration Across Popular Platforms
Free PDF Analysis Made Easy with ChatGPT