There is no doubt, Microsoft Word is one of the best tools for word processing. But if you start exploring the capabilities of Microsoft word you will be intrigued by its ability to help you carry out a number of other tasks with the help of this premium program. One of them is the ability to create flowcharts. A flowchart is a set of block diagrams, connecting each other, where you can represent taking inputs, decision-making, processing something to deliver an output depending upon the inputs, processes executed and the decisions taken. Flowcharts can be useful to create a visual idea of a project before you start working on it and also before you start working with computer programs so that you don’t face any problem at the time of writing the same.
Once a flowchart is created, it becomes visually convenient to find out errors in the same so that you can and make the necessary changes and finally proceed with executing the project or whatever you are planning to do. If you have Microsoft Word or Microsoft PowerPoint, you can simply use any one of them to create a flowchart. Depending upon whether you want the hard copy or PDF of a flowchart, or you want to keep it in a presentation you can either use Microsoft Word or Microsoft PowerPoint to create the presentation. Due to the similarity in the tools available for creating a flowchart in both Microsoft Word and PowerPoint, the process will hardly vary, no matter which program you are using.
So without any for the delay, let’s get started with how you can create a flowchart in Microsoft Word and Microsoft PowerPoint, whichever is convenient for you.
Creating flowcharts in Word or PowerPoint
I will show the tutorial here in Microsoft Word and there is hardly a difference in the process if you are using Microsoft PowerPoint for the same.
Before you can start creating flowcharts, I will talk about the different basic flowchart symbols, which you should use at the time of creating a flowchart.

This block will point to the beginning or end of a flowchart, and also continuations if the flowchart requires multiple pages or slides.

This block is for the purpose of taking inputs and generate outputs. For example, if you want to write a program to carry out a mathematical operation of two numbers, you can use this block to visualize the process of taking inputs.

This block is used if there is any kind of processing that is involved in your flowchart. For example, if you want to find the sum of two numbers you can give the mathematical operation in this block.

This block is useful for making decisions. For example in the case of mathematical operation where you are to find which one is greater among two numbers. You can send first output if the first number is bigger than the other, and send a second output, if the first number is smaller than the other, any other third operation that you want to carry out depending upon the specific conditions.

This is just a connecting line between two blocks and it also shows the direction in which the flowchart is proceeding. The direction of the flowchart is pointed out by the arrow.
Those were the basic flowchart symbols that you should know. There are other symbols, as well, which can be useful for engineering, process control, and other complex processes.
In this article, I will show a flowchart, where two numbers will be taken as input, and subsequently, the sum of the numbers will be calculated. Once done, the system will show an output, i.e. “The result is an even number”, or “The result is an odd number”, depending upon whether the sum of the two numbers is odd or even, and after that, the flowchart will come to an end.
So, let’s find out how you can create a flowchart for the same.
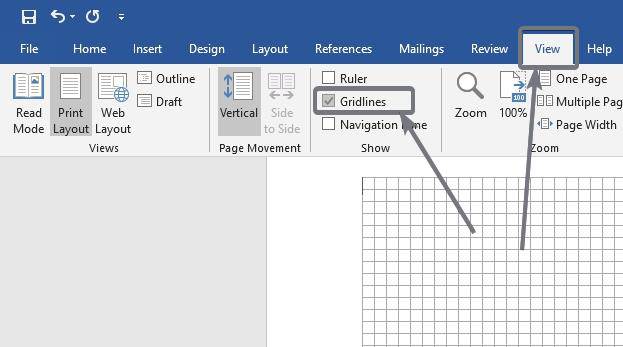
For proper alignment of the shapes, I will recommend you to enable ‘Gridlines’ on Microsoft Word and PowerPoint. You can do that by marking ‘Gridlines’ under the ‘View’ tab.
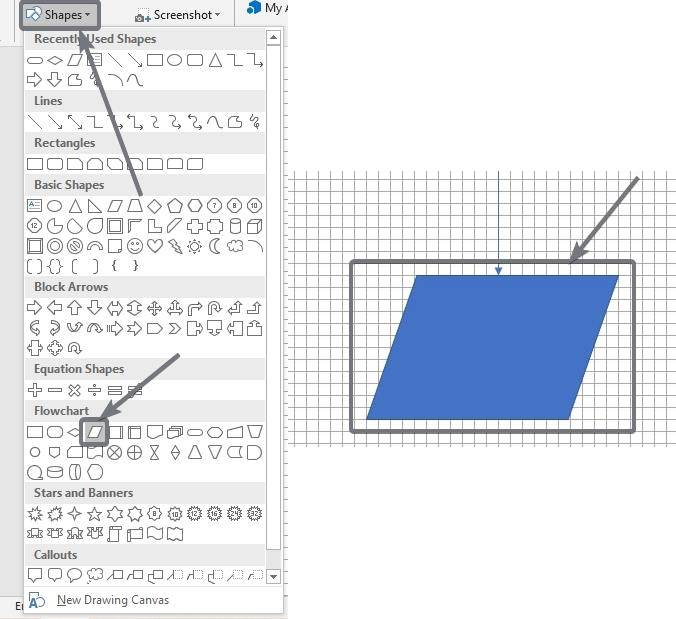
Click on the ‘Insert’ tab and then click on the dropdown menu corresponding to ‘Shapes’. Now click on the ‘Terminator’ shape to draw the shape on the flowchart.
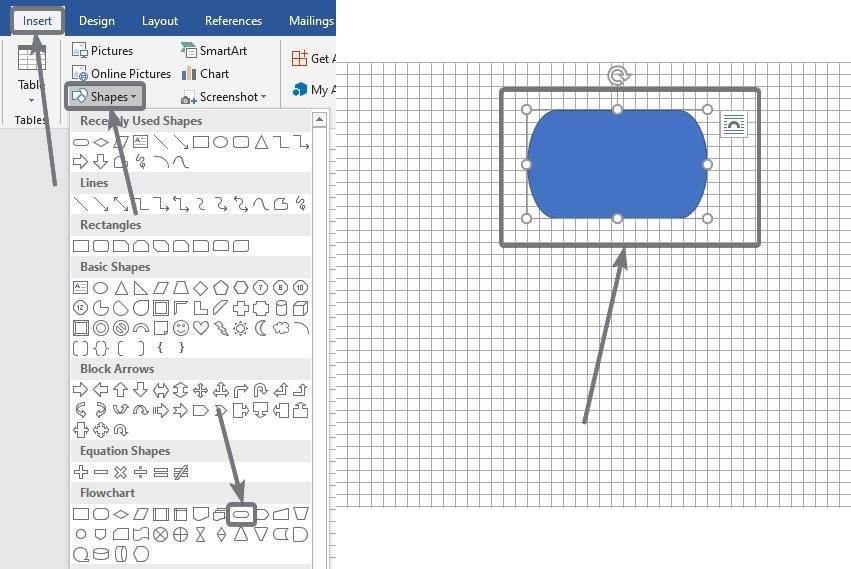
Now, you can modify the shape and size of the Terminator, using the small dots around the oval.

Now right-click on the shape and click on ‘Add Text’.
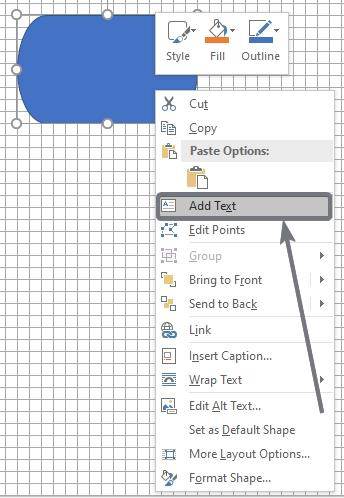
You can write any text here, but I recommend you to write ‘Start’ or ‘Process Start’ to mark the beginning of the flowchart.

Now once again click on shapes, and click on the preferred ‘Arrow’ icon to start drawing an arrow from the terminator.
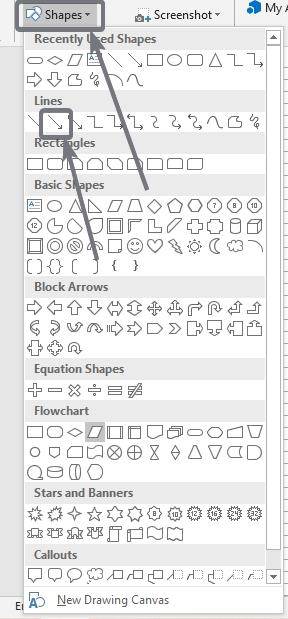
You can either choose a line arrow or an elbow connector, which is the one that can be bent as per your requirements.
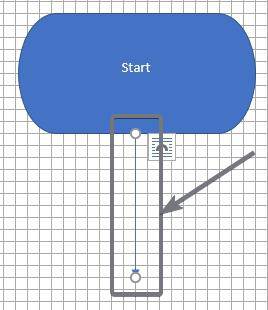
Now draw the line corresponding to the gridlines to get the best look out of the flowchart.
Next, you have to add the shape that comes with the name ‘Data’ and put it on the page. Just connect the end of the arrow that comes out from the terminator that comes with the shape ‘Data’.
Now keep adding shapes to your flowchart until you get something like this as I have shown in the screenshot below.
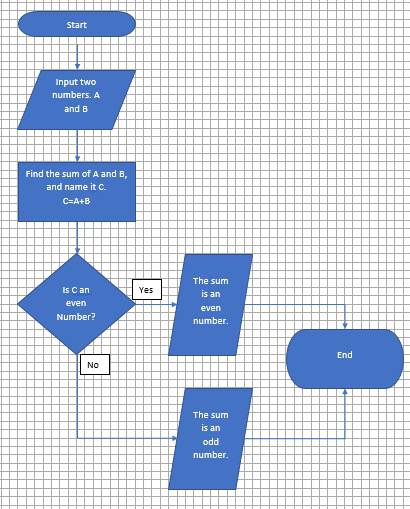
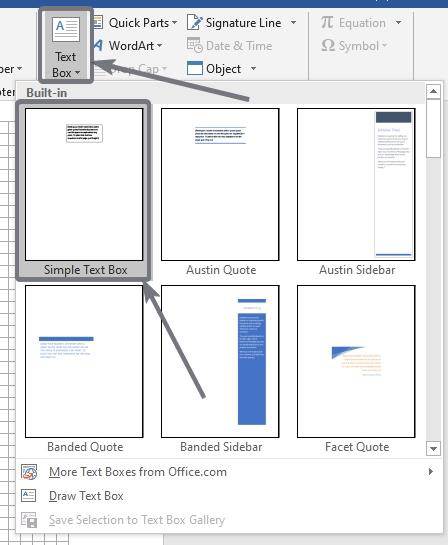
Just keep adding the shapes unless you get the flowchart that you are actually looking for. To add the ‘Yes’ and ‘No’ for the decision-making block you can simply use a small text box that is available under the ‘Insert’ tab.
Just put the two text boxes, at the point, where the arrows begin.
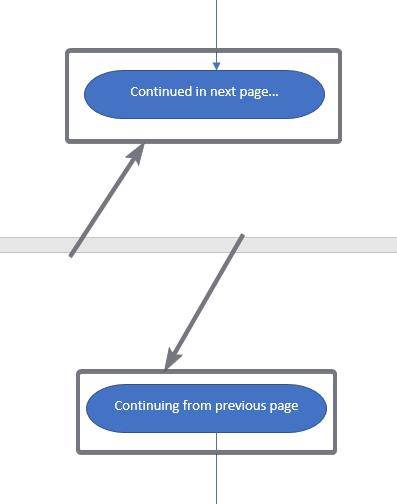
Creating a flowchart before you start proceeding with something can really be useful to analyze the challenges associated with it, and work out on them to finally become successful and reach the destination. Depending upon what exactly are you looking for, the flowchart can take more than one page and in that case you can use the Terminator shape at the end of the first page, write some comment there, and another Terminator shape in the next page that will typically say ‘Continuing from previous page’, just the way it is shown in the screenshot below.
You can do the same for slideshows as well if you are creating a presentation with the flowchart, on Microsoft PowerPoint.

The process is exactly the same on Microsoft PowerPoint, the only difference is, you have to work with slides instead of pages, but the shapes that are available on Microsoft PowerPoint is just the same.
So, that was all about how you can create flowcharts in Microsoft Word or PowerPoint. Are you facing any trouble creating flowcharts? Feel free to comment on the same below.
Related Posts
How to create email groups in Gmail? Send one email to multiple recipients in a matter of seconds.
Getting the right dashcam for your needs. All that you need to know
How to Install 7-Zip on Windows 11 or 10 with Single Command
How to Install ASK CLI on Windows 11 or 10
How do you install FlutterFire CLI on Windows 11 or 10?
How to create QR codes on Google Sheets for URLs or any other text elements