As a Data Analyst as well as Scientist it is very important to analyze data to generate valuable insights from it. This not only helps to solve problems underlying the problem but also helps analysts to provide an inside glimpse of the data with much beautification. For Data Analysis and Machine Learning people are shifting from obsolete programming languages to simpler ones that are syntactically lesser and are faster and robust in the mechanism. So, is the power of one such language called Python.
This programming language is getting immense popularity amongst the Data Science and Analytics community because of its user-friendliness behavior. Keeping these things in mind and talking related to the context of the topic Python contains numerous Data visualization libraries out of which users can choose their preferred one. The libraries include Matplotlib, Seaborn, Plotly, GG Plot, Bokeh, etc. These libraries are bosses in their domain and help in plotting very beautiful plots with lesser coding.
Today the library that we will be talking about is the Plotly library in Python. This library is a third-party package that is manufactured by Plotly officials and was mainly made to help the Healthcare sector as well as other prominent sectors of the society to help them in properly visualizing certain things essential for analysis. Although Plotly provides n number of options in plotting graphs the codes are a bit complex so, Plotly officials launched a different version of Plotly called Plotly express and today we will be learning how to use Plotly express along with its installation:
Installation
The installation steps as discussed are being done keeping in mind that you already have either Python or Anaconda and pip downloaded in your system.
Install Ploty Library using normal Python Installation on Windows, macOS, or Linux
- Open your Command Prompt and then check for the availability of Python by just typing
python –-version. If it throws no error and displays the current version of Python then you are good to go. - Just type
pip –-versionthe same way you did for Python. Again if it throws no error then pip is there in your system. - Once you have made sure the prerequisites already present just type
pip install Plotly. - The installation will take a few minutes depending upon the internet speed and size of the package. Once done you have successfully downloaded the Plotly package. This Plotly package will be containing the Plotly express tool as well.
Anaconda Installation:
- Open your Command Prompt and then type
condato check for the availability of Anaconda in the system. If it is present then you will not get any error rather you will get some details that could be beneficial to you to work using Anaconda. - Once Anaconda availability is checked check for the availability of pip the same way we did with normal Python installation.
- After this, the main task is to create a new environment in Anaconda by typing
conda create --name myenvin the Command Prompt. Once this is done you have created a new virtual environment successfully and now are good to go to the next step. - Activate your environment which you just created using
conda activate yourenvnamein the CMD. Once done typepip install Plotlyand wait for the package to get downloaded.

Importing Plotly Express in Jupyter
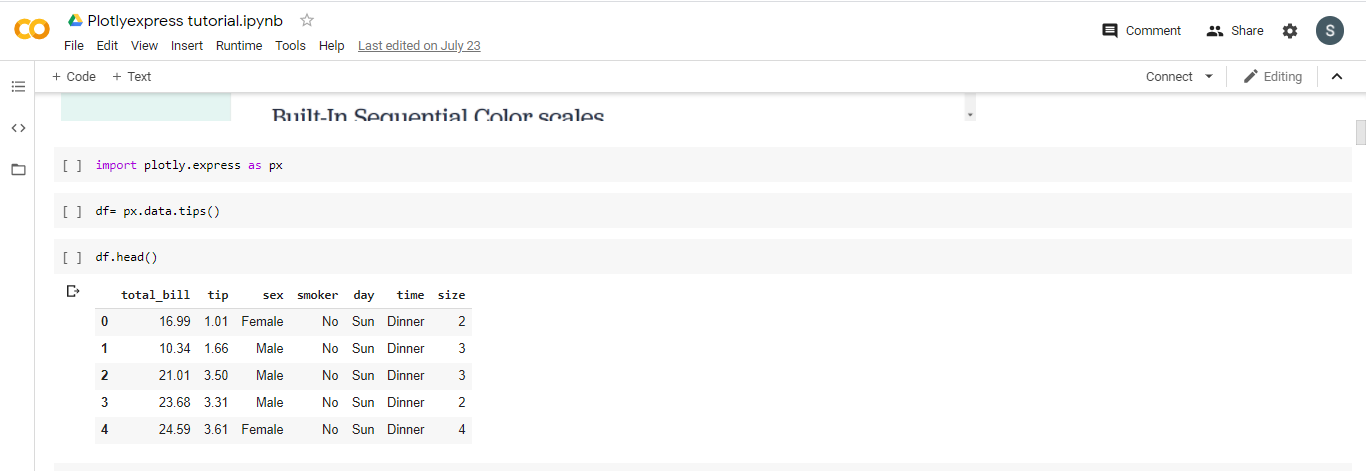
Once the installation is done you can open a good data visualization editor of your choice like Jupyter, Jupyter Lab, Google Colab, and import the Plotly express library. To do this just type import Plotly.express as px. The library will be imported for you. Let’s now take a look at the various kinds of graphs we can plot using Plotly express with fewer lines of code:
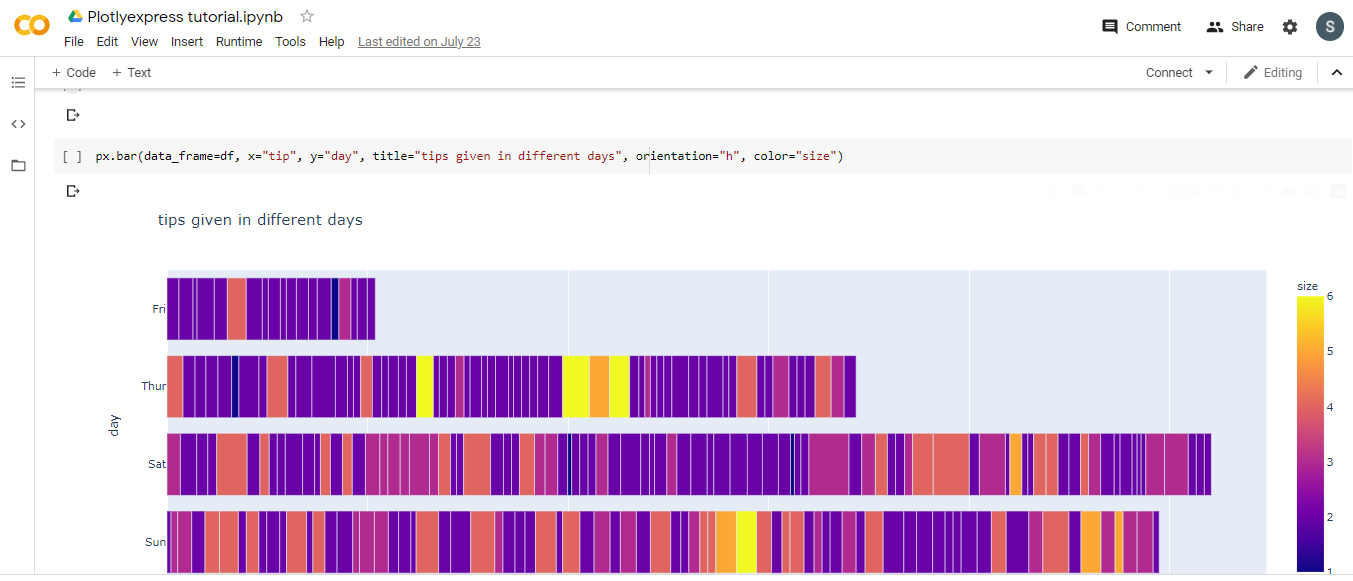
BAR PLOT

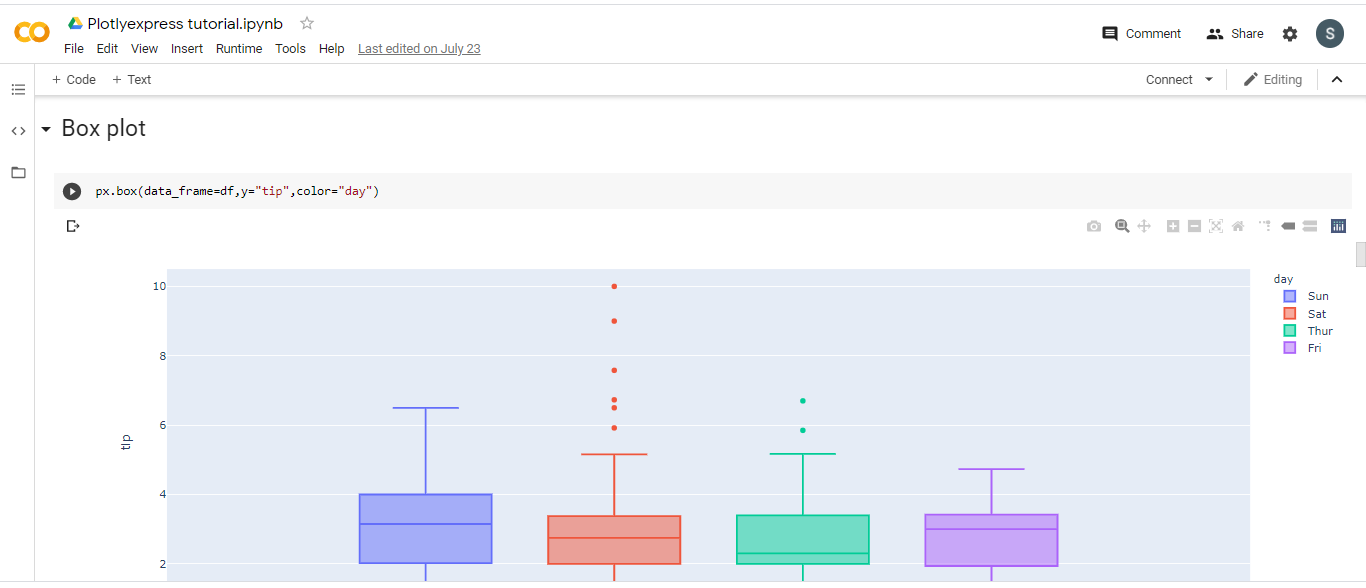
BOX PLOT
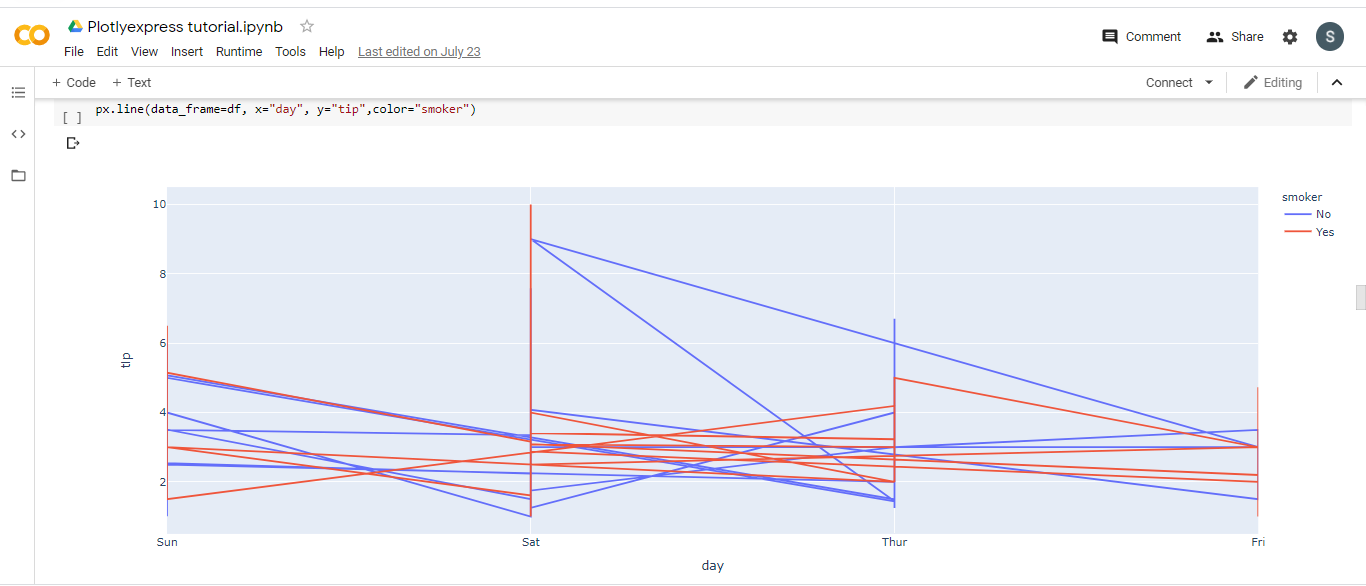
LINE PLOT
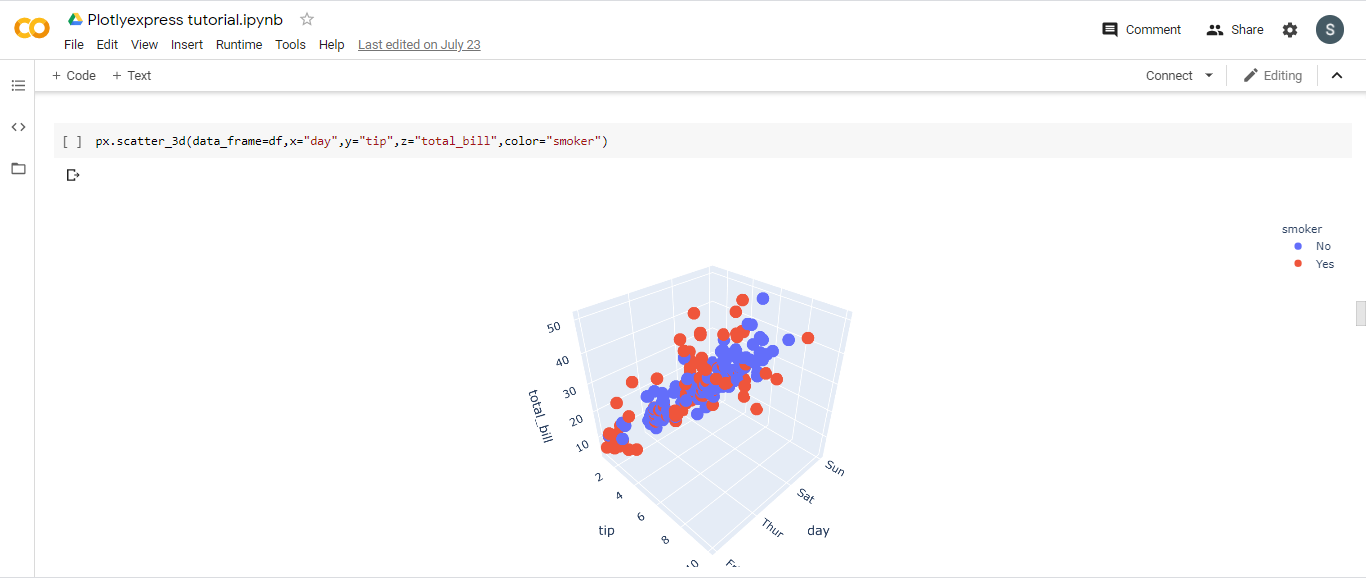
3D SCATTER PLOT
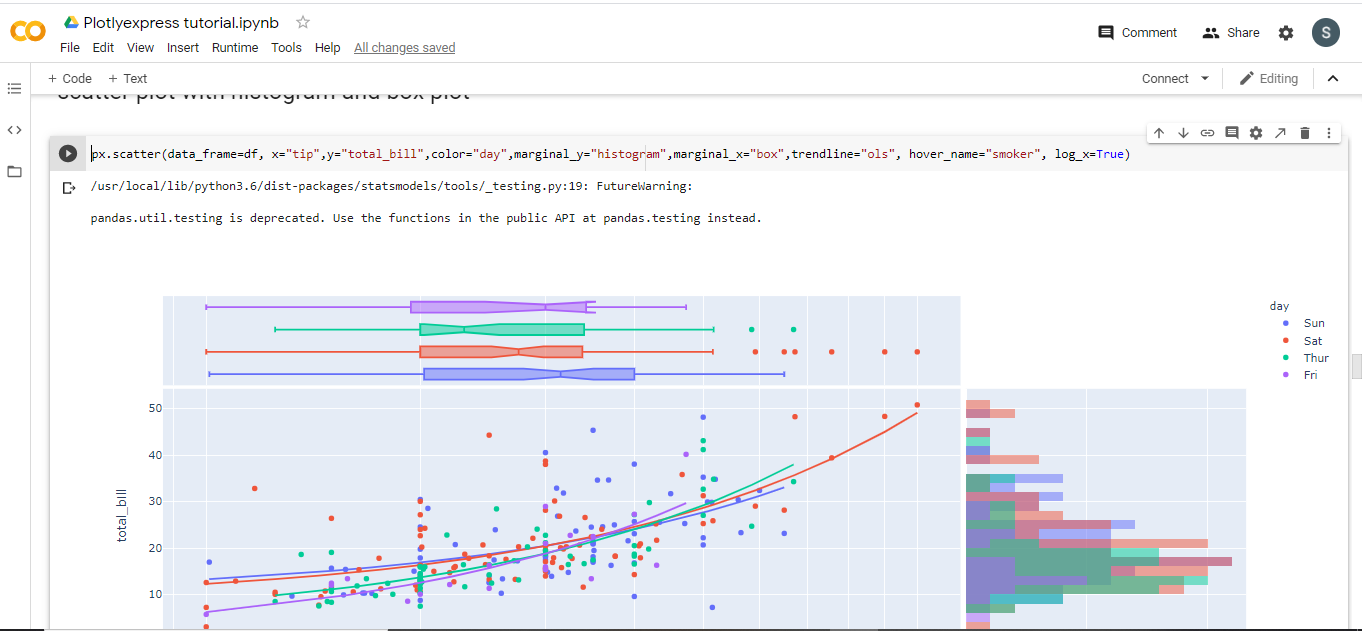
SCATTER PLOT WITH HISTOGRAM AND BOX PLOT
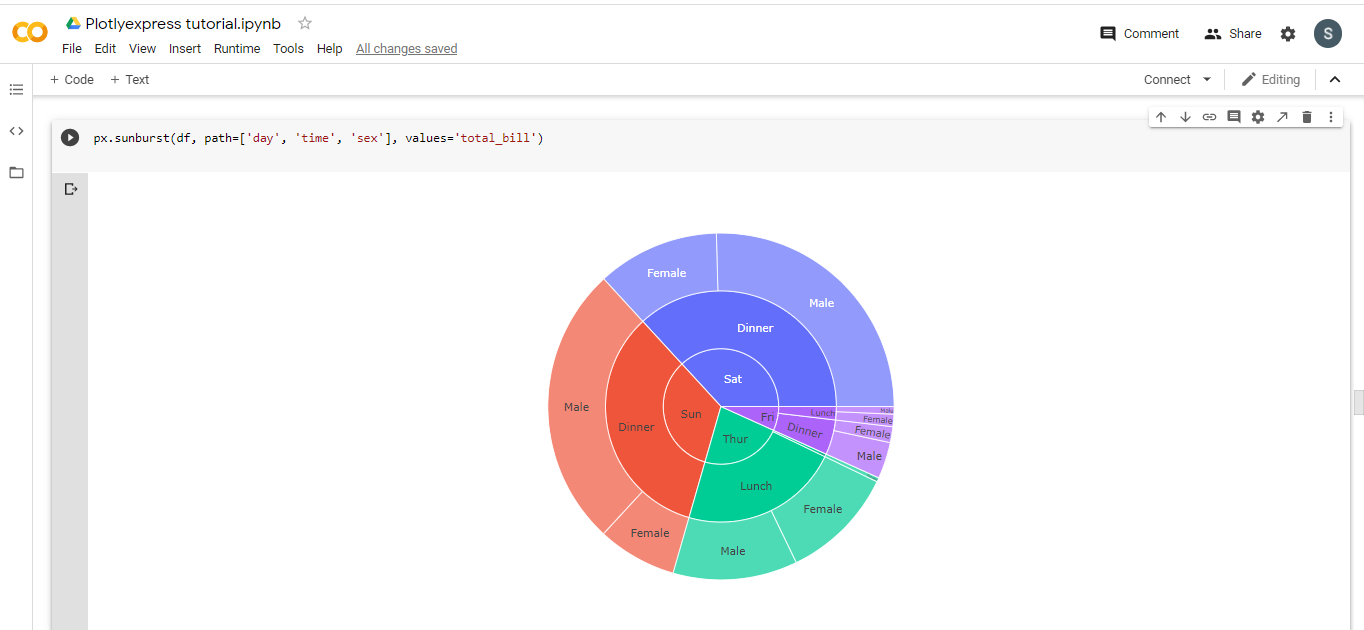
SUNBURST PLOT
There are many other plots also that you can use using this library and for proper details, you can visit www.plotly.com.
Conclusion
So, this is how one can plot various types of interactive plots using Plotly on which you can hover around to see various data points and can also animate your graphs. For more understanding, you can go to the official website of Plotly or can follow various tutorials on YouTube.
Related Posts
How to create email groups in Gmail? Send one email to multiple recipients in a matter of seconds.
Getting the right dashcam for your needs. All that you need to know
How to Install 7-Zip on Windows 11 or 10 with Single Command
How to Install ASK CLI on Windows 11 or 10
How do you install FlutterFire CLI on Windows 11 or 10?
How to create QR codes on Google Sheets for URLs or any other text elements