There is no doubt it is easy to deal with charts and data on Microsoft Excel than most other potential programs that can help you do the same. Well, after you have created a chart using the data that you have in your hand, you can display it in an intuitive way through a presentation, embed it in your report which might be a document file so that you can print it as a PDF. When it comes to dealing with normal documents and presentations, Microsoft Excel isn’t the tool for that. As you might already know, you have Microsoft Word and Microsoft PowerPoint to deal with documents and presentations respectively.
But when you want to use the chart that you have prepared with Microsoft Excel, within your presentation on Microsoft PowerPoint or within a document on Microsoft word, you first need to extract it in some form so that you can use it in any of the programs that you want to use. Even if you do not want to use Microsoft word at all, but want to use it in some other program you can also do that after you have extracted the chart from the Microsoft Excel sheet. So, today I will talk about how you can extract charts from a Microsoft Excel sheet or workbook so that it can be used elsewhere.
Basically, there are two ways you can extract the charts from a Microsoft Excel spreadsheet, which are the easiest, and I will discuss both of them here.
Method 1: Using an image editing software
Step 1: This method can be useful, if you are having a limited number of charts within a Microsoft Excel sheet or just want to extract a single one from many, as it is going to involve a lot of manual effort to deal with multiple charts, obviously if you have within a sheet.
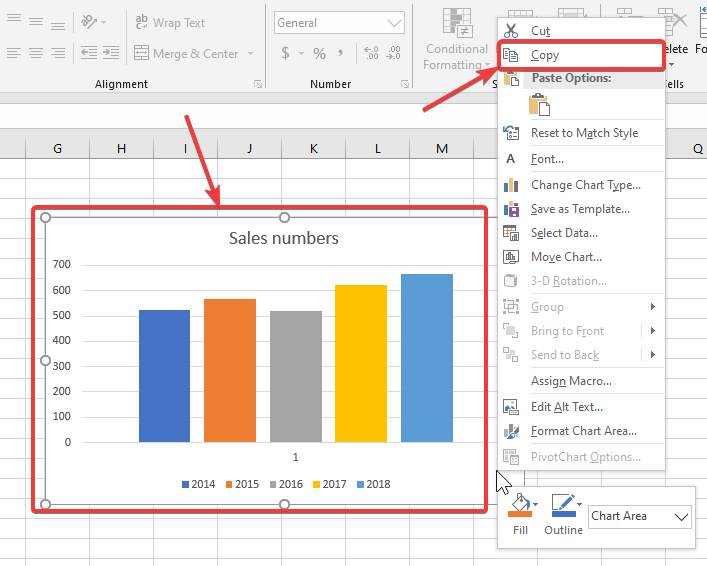
Step 2: After the sheet is prepared and the chart is in front of you, just right click on the chart and click on ‘Copy’ to copy the chart to your clipboard.

Step 3: Now, the chart is copied to the clipboard, you can open any image editing program like Microsoft Paint, which is the simplest one, or you can even use Adobe Photoshop or GIMP, if you want to do some advanced modifications with the image and if you are comfortable using them. I will be using Microsoft Paint here, as that is the simplest one.
After you open your favourite image editing program, which is Microsoft Paint for me you just have to right-click and click on ‘Paste’ to paste the chart as an image.

You can simply use Ctrl + C and Ctrl + V, as well, to copy and paste the chart respectively.
After you have posted the chart, just save the chart as an image file in your desired location. Now the chart is available with you in image format and you can use it anywhere you want, exactly the same way you deal with still images within a document, presentation, or elsewhere.
But, if you are having multiple charts, doing this individually will not always take a lot of time but will make you feel monotonous. As there is another way, better go with that, for multiple charts.
Method 2: Extracting from HTML
Step 1: After you have prepared your sheet or workbook, you have to save it in HTML format instead of saving it in regular XLSX or the compatible XLS format. You can do that by using HTML from the drop-down menu in the ‘Save’ dialogue box.

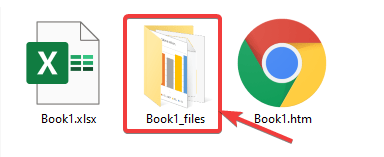
Step 2: Once you save the workbook in HTML format in the desired location, you can also find a folder in the same location that bears the name of the HTML file.

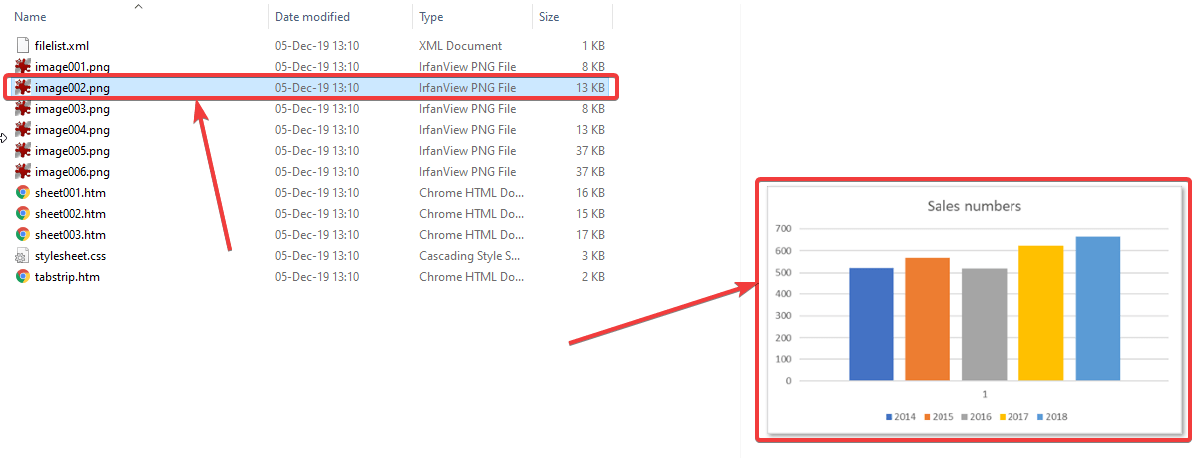
Step 3: Here, you can find all the charts and other images within the workbook and each of them will be present in PNG format.

Even though PNG formats will not create any kind of problems if you want to use it in your document-representation or anywhere else, you can even convert the images to JPG format, which is a most compatible image format that can also be opened on your smartphone and other devices.
As long as you have the charts within a workbook in the form of images, you can use them anywhere you want and that’s what I have discussed here.
So, that was all about how you can extract the charts from a Microsoft Excel workbook or sheet. Do you have any questions or face any problems? Let me know about that in the comment section below.
Other Articles:
- How to use VLOOKUP in Microsoft Excel with a basic example
- Tutorial to search for and delete duplicate files on a Windows
- How to create drop-down menus is Google Sheets
Related Posts
How to create email groups in Gmail? Send one email to multiple recipients in a matter of seconds.
Getting the right dashcam for your needs. All that you need to know
How to Install 7-Zip on Windows 11 or 10 with Single Command
How to Install ASK CLI on Windows 11 or 10
How do you install FlutterFire CLI on Windows 11 or 10?
How to create QR codes on Google Sheets for URLs or any other text elements