Netdata real-time system monitoring tool is not available in general for Windows operating system rather for Linux, FreeBSD and MacOS. However, becuase of Windows Subsystem for Linux, we can install and test it on Windows 10.
Netdata is a very popular open source real-time Linux performance monitoring which quite very useful. It is very powerful and very simple to install too, just one command and everything will set for you. The best thing it is a web-based application and all the stats of your server or desktop will appear on a browser with beautiful graphs. Thus, without any maintenance, it displays all monitoring data directly in the browser. Netdata collects thousands of metrics per second, but only accounts for 1% of the CPU single core, a small amount of memory, and no disk IO read and write. On Windows netdata using WMI to collect the data of system in real time.
Here we will show you how to simply install it on Windows 10 WSL running Ubuntu Linux operating system…
Step 1: Enable Windows Subsystem for Linux
As Netdata is a Linux OS application, thus first we need to enable Linux compatibility layer on our Windows 10 operating system. To turn it ON, just search for “Turns Windows feature on or off” and select Windows subsystem for Linux. And the install Ubuntu WSL image from Microsoft store. All this you can see in our other tutorial: Install Windows Subsystem for Linux with Ubuntu.
Step 2: Install netdata on Windows 10’s Ubuntu WSL
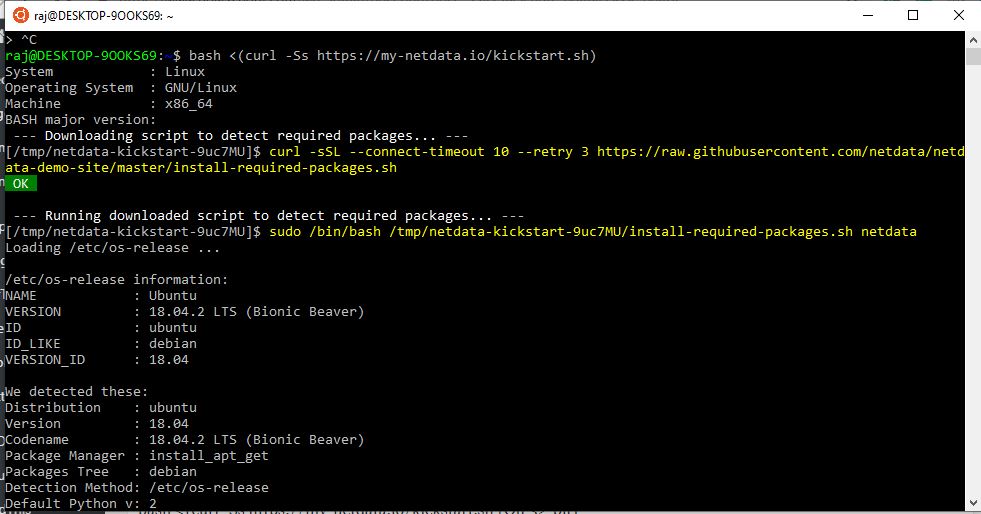
After enabling and installing the Ubuntu on Windows in the above step, its time to install Netdata using the below command:
bash <(curl -Ss https://my-netdata.io/kickstart.sh)
While downloading and installing the netdata Linux monitoring tool, the setup will multiple times your permission to install dependent packages. So, whenever that happens type Y and hit Enter button.
Note: In between a pop-up will appear from Windows firewall to allow the access of tool in browser publically, just allow that.
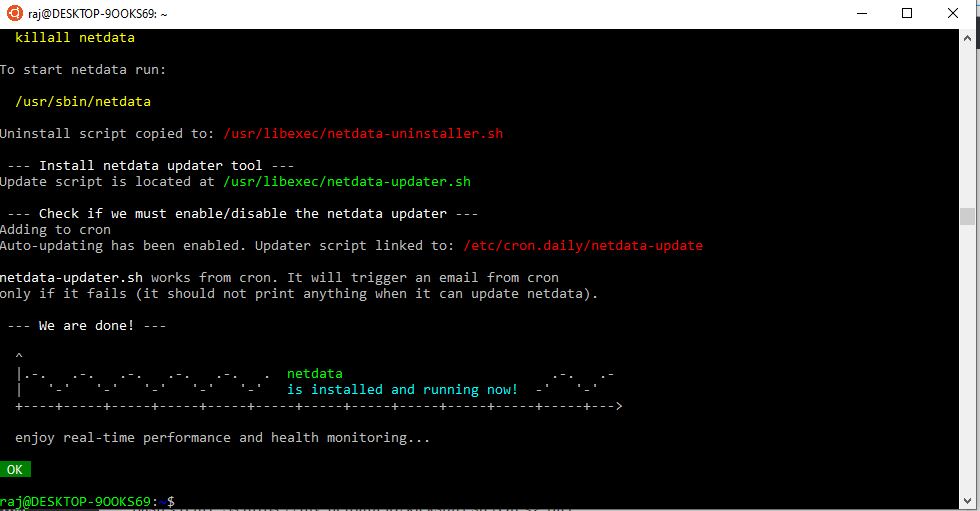
Step 3: NetData Installation on Windows Done
After installing multiple packages and setting them up for you, finally, it will say netdata script has done the installation process and now you can use this monitoring tool. Go and open your browser.
Step 5: netdata Dashboard/Web interface and Netdata Port
The port which uses by the Netdata is 19999, thus simply open any browser installed on your Windows 10 operating system and type your system’s IP address or localhost along with port number 19999. For instance, 127.0.0.1:19999.
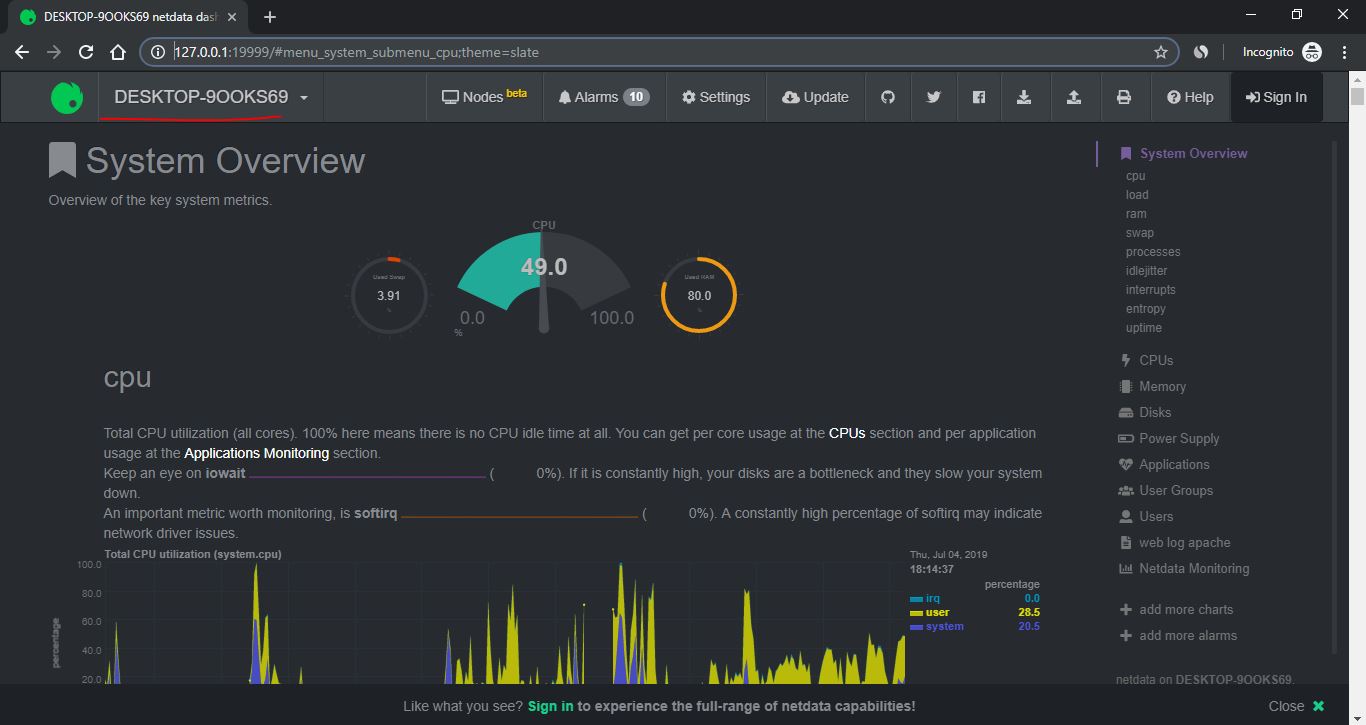
The individual monitoring data is updated in real time, you can also click to view the details with the mouse.

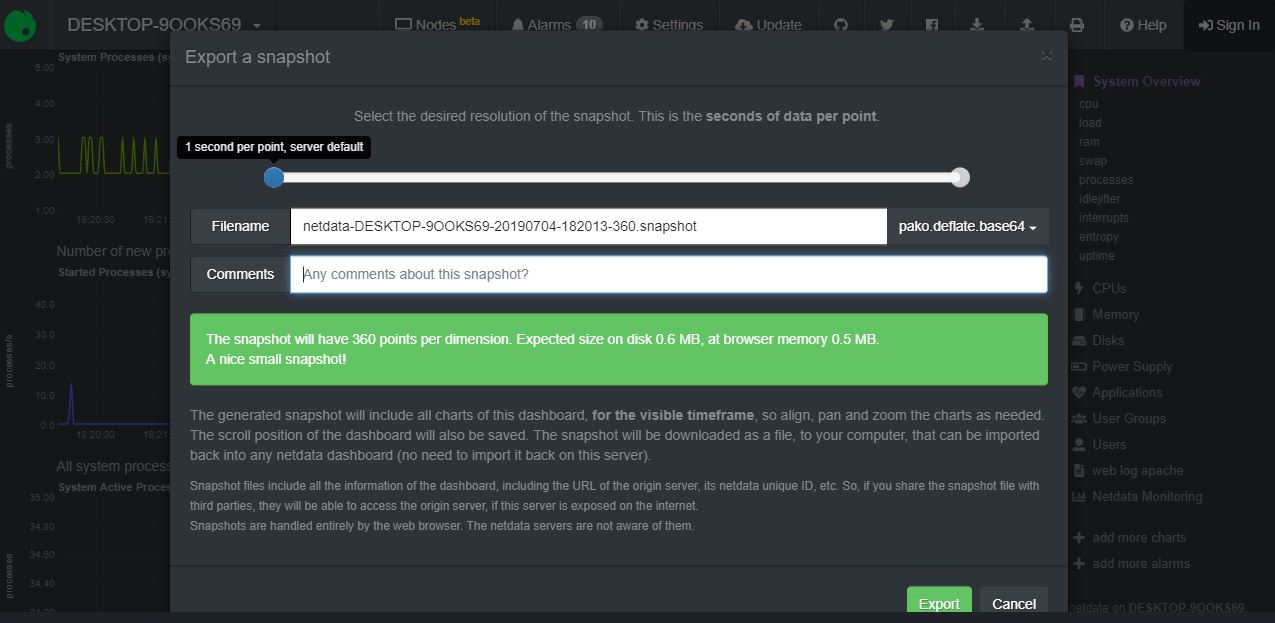
Netdata has import and export functions, you can export monitoring data for a certain period of time, and you can also import backup data.
Step 7: Access multiple systems stats from a single browser
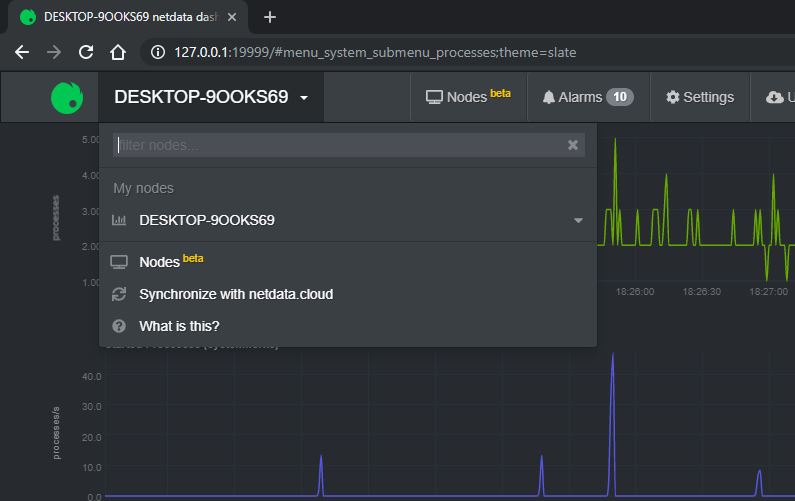
There are two ways to monitor multiple servers or machines Netdata from a single browser screen, one is using Netdata.cloud synchronization and other is using the unique registration ID.
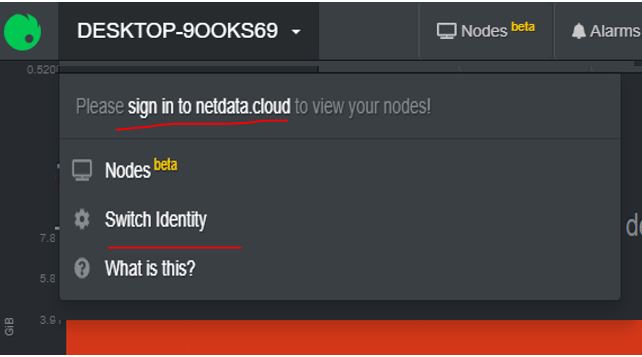
If you want to register your netdata running server on netdata cloud then select option “Sign in to netdata.clod”. By adding each and every monitoring system to the cloud, you can access them all from a single Node window.
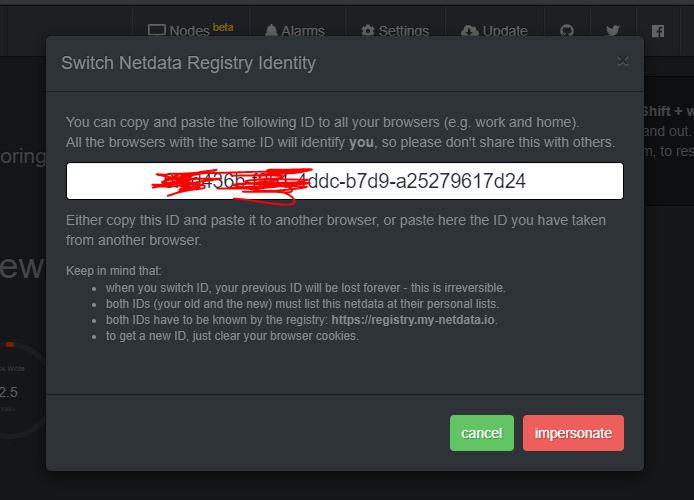
Or else simply click on Switch Identity and note down the registry ID. After that in which system you want to open some your current system feed or monitoring, there just paste the copied ID.
How to update
To update Netdata simply execute the update script of this tool:
cd /usr/libexec
sudo ./netdata-updater.sh
How to uninstall Netdata from Linux
To remove this monitoring tool from your Windows 10 running on Ubuntu WSL use the following command:
cd /usr/libexec
sudo ./netdata-uninstaller.sh --yes
After running above command press Enter button to delete all the files…
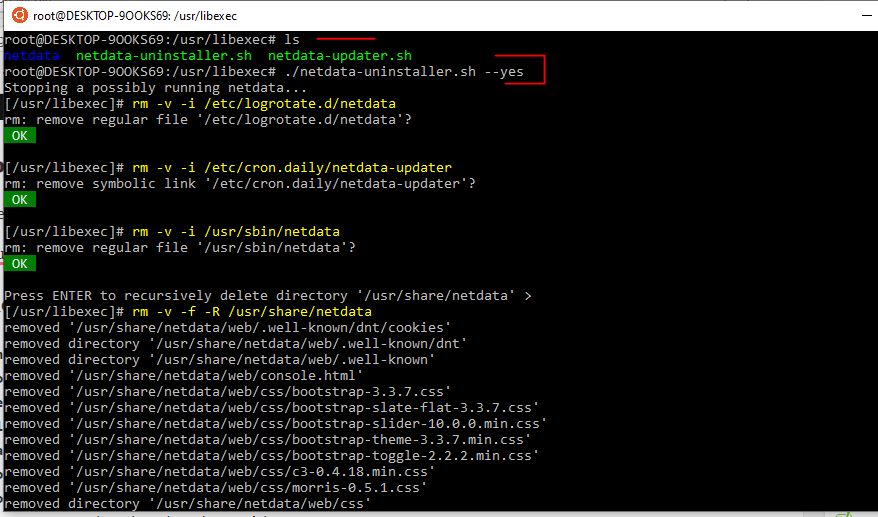
The directory structure of this tool is as follows:
– the daemon at /usr/sbin/netdata
– config files in /etc/netdata
– web files in /usr/share/netdata
– plugins in /usr/libexec/netdata
– cache files in /var/cache/netdata
– db files in /var/lib/netdata
– log files in /var/log/netdata
– pid file at /var/run/netdata.pid
– logrotate file at /etc/logrotate.d/netdata
Netdata monitors a wide range of things, some of them are:
- CPU: usage, interrupt, softirqs, frequency, total and per core CPU state
- Memory: RAM, swap and kernel memory usage, KSM (kernel same page merge), NUMA
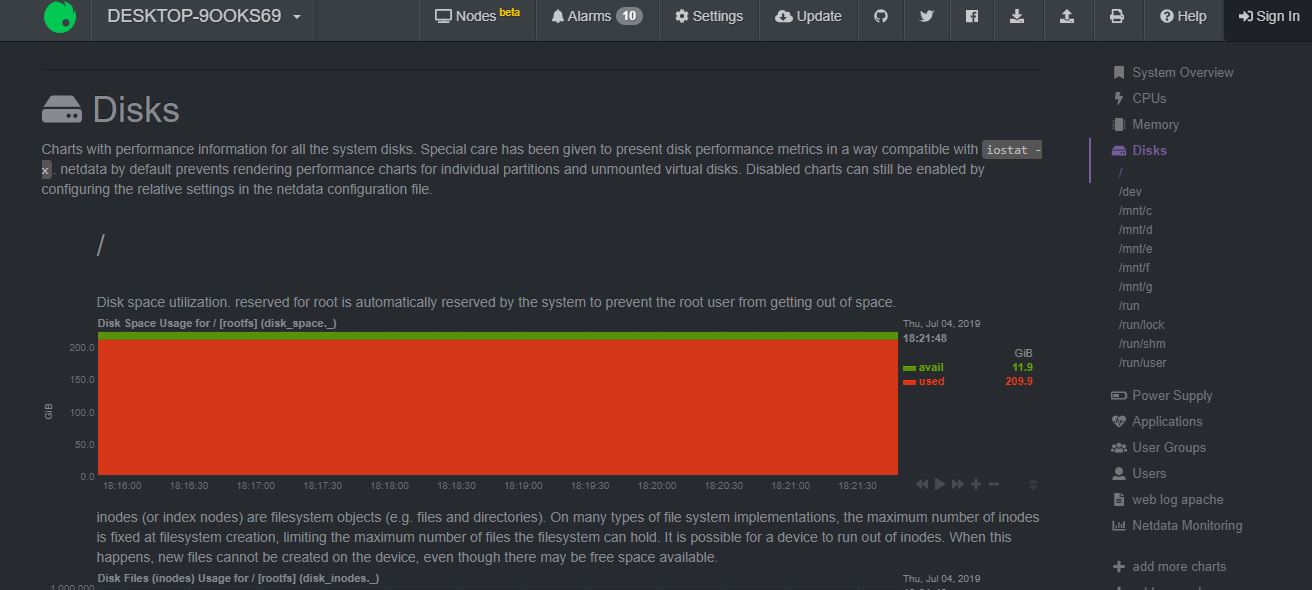
- Disk: Per disk: I/O, operation, to-do, utilization, space, software RAID (md)
- Network interface: each interface: bandwidth, packet, error, discard
- IPv4 network, IPv6 network: bandwidth, packet, error, fragment, tcp: connection, packet, error, handshake, udp: packet, error, broadcast: bandwidth, packet, multicast: bandwidth, packet
- Netfilter / iptables Linux firewall: connection, connection tracker event, error
- NFS file server and client: NFS v2, v3, v4: I / O, cache, read-ahead, RPC call
- Apache and lighttpd web servers: mod-status (v2.2, v2.4) and cached log statistics for multiple servers
- Netdata can monitor Nginx web server: stub state for multiple servers
- Tomcat: access, thread, available memory, volume
- Web server log files: extract web server performance metrics in real time and apply multiple health checks
- mySQL database: multiple servers, each server display: bandwidth, query/handler, lock, problem, tmp operation, connection, binlog metric, thread, innodb metric, etc.
- Postgres database: multiple servers, each server shows: each database statistics (connection, read-write – returned tuples, transactions, locks), back-end processes, indexes, tables, write advances, background writers, etc.
- Redis database: multiple servers, each server shows: operation, hit rate, memory, key, client, slave
- CouchDB: read/write, request method, status code, task, copy, per-db, etc.
- Memcached database: multiple servers, each server display: bandwidth, connection, project
- NSD name server: query, region, protocol, query type, transmission, etc.
- PowerDNS: query, answer, cache, delay, etc.
- Postfix email server: message queue (entry, size)
- NUT and APC uninterruptible power supplies: load, battery, battery voltage, temperature, utility, output indicators
- PHP-FPM: multiple instances, each report connection, request, performance
- Smartd: disk SMART value
This monitoring tool also supports plugins, see all the Netdata plugins list and way to configure them.
The project is available on Github.
Also, have a look at 8 Best CPU temp monitor tools for Windows 10/7.


NOT WORKING
Wow. Such a well written on-point article. I was going to install netdata on a production server but thought to give it a shot first with WSL. Working as expected.
It’s working but missing disk read and write as well as net inbound and outbound. Any ideas how to get this displayed at the top like it usually is? These are 2 vital things I’d like to monitor.
Thanks!
The explanation works flawlessly. But my netdata process uses 700% CPU when running. Any idea?