Google Sheets data analysis, a free business analytics tool which is a handy way to analyse raw data gathered from different sources. Millions of terabyte of data is generating by digital devices around us to provide meaningful information. In today’s world, the data’s power is invincible, we can use it to increase sales, grow customers, create better products; to understand the behaviour of human being and a lot more. Why do you think different companies collecting data from their online visitors or consumers including Google? It is to analyse that raw data to precisely offer various services. It not only increase the sales of a company also helps customers to get exactly what they want.
So, if you have some raw data then you don’t need to buy some expensive software to discover useful information by inspecting, cleansing, transforming, and modelling it. You can use Google’s Sheets to analyse data using in-built Google Machine learning and Artifical intelligence that will discover useful information and conclusions to support you in decision-making.
So, here we use Google Sheets data analysis to make you walk through different available options, that can help us in data filtering, Sorting, Find Extremum, automatically analysis of data, adding of the chart, formula, or pivot table and asking different questions to Google’s AI to automate the analysation of Spreadsheet. Google Sheets data analysis would also be really helpful in decision making for the data collected from some survey using online forms, for example, Google forms.
How to import Spreadsheet or raw data to Google Sheets?
The first task in direction to find some meaning information from our raw data is to either upload excel or spreadsheet file directly or copy all data from it and paste it in Google sheet.
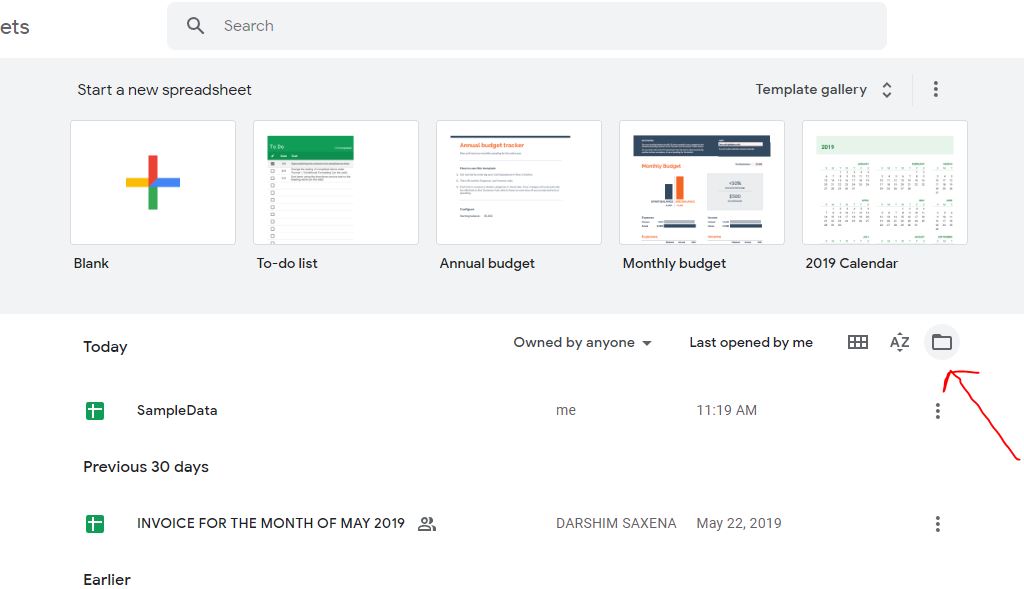
To upload your spreadsheet/excel file first visit this link to open Google Sheets and then click on the folder icon given on the right side.
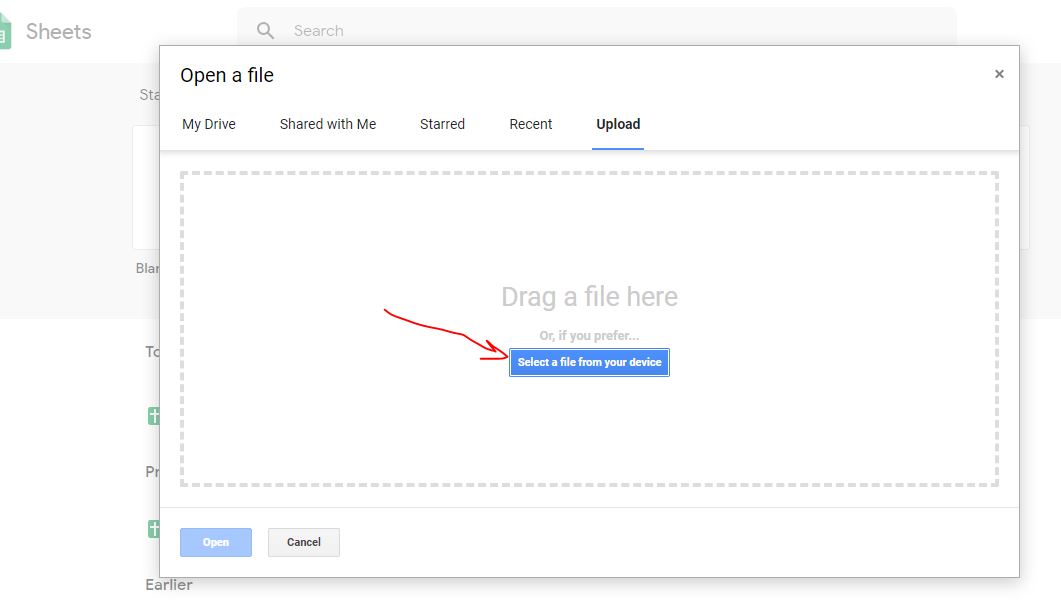
Now, click on the Upload tab then either click on “Select a file from your device” button or simply drag and drop the spreadsheet file. Once it gets uploaded, the file will show on the Google Sheets main screen. Click on it to open.
After uploading, if there is any kind of formatting which you want to remove from the sheet then go to the menu select Format and Clear Formatting or CTRL+\
Sorting of Data
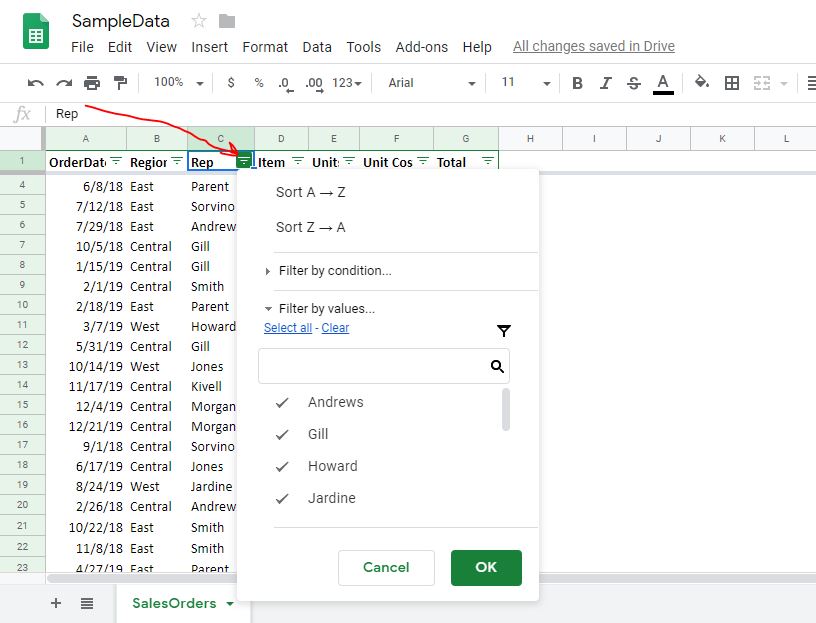
To sort data any data take your mouse pointer on any column top and as you hover on it, a drop-down icon will appear, click on that, which will reveal all data sorting options such as ascending or descending, randomize range including conditional formatting and more…
Add filter to your data
To add a filter to the range of data, so that you can find and focus on some particular range. Just like Microsoft Excel, you can also use the filter icon.
Click on any cell and then on the filter icon given right side in the menu. This will show a filter icon on the header cell of each column.
Clicking on any filter will reveal options such as Sorting A to Z or Z to A (data wise), to filter some particular data range from the sheet including Filter by the condition. In the conditioning filter, you will see so many predefine conditions like -Filter by empty cell, filter by some particular name or value, filter values greater or lower than defined by you etc.
Google Sheets formulas:
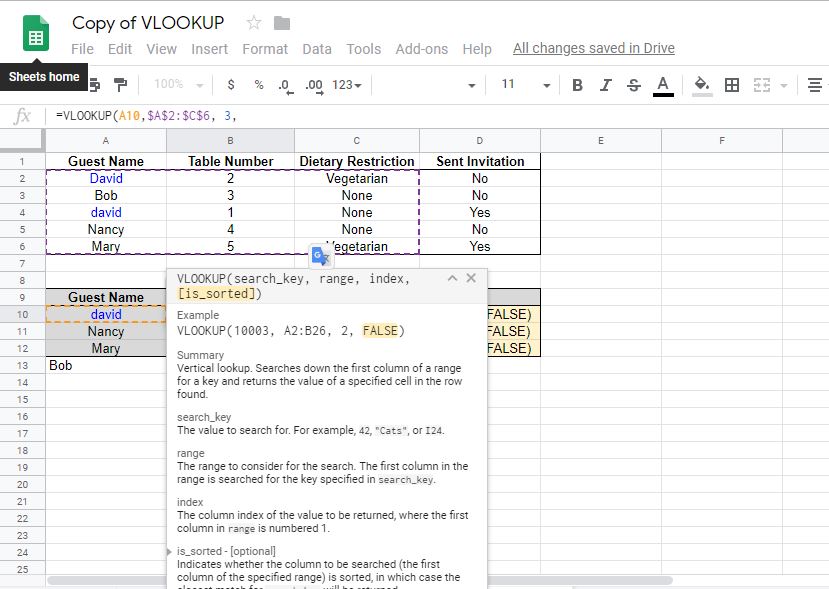
Google sheets come with a wide range of formulas that reduce your time of working with a huge amount of data, especially with multiple sheets. The best thing of using formulas here is, as you type ‘=‘ with the formula you want to use, the Google sheets will show tips on how to use that particular one you are up to. It is really helpful for new users those are not much familiar with different functions and formulas such as HLOOKUP, INDEX, Addition, LOOKUP, VLOOKUP, ABS etc. It is not possible for us to mention the way of using each and every formula, however, this job already has been done by the Google for you including live sheet example along with demo data using the particular formula you are looking for.
Hence, to see all Google sheet formulas along with examples, see this link.
Make a chart in Google Sheets
After sorting, filtering and performing other tasks, in case you want to a look for your final data in chart/graph form to understand it a better way, then Google Sheets has an inbuilt Charting option.
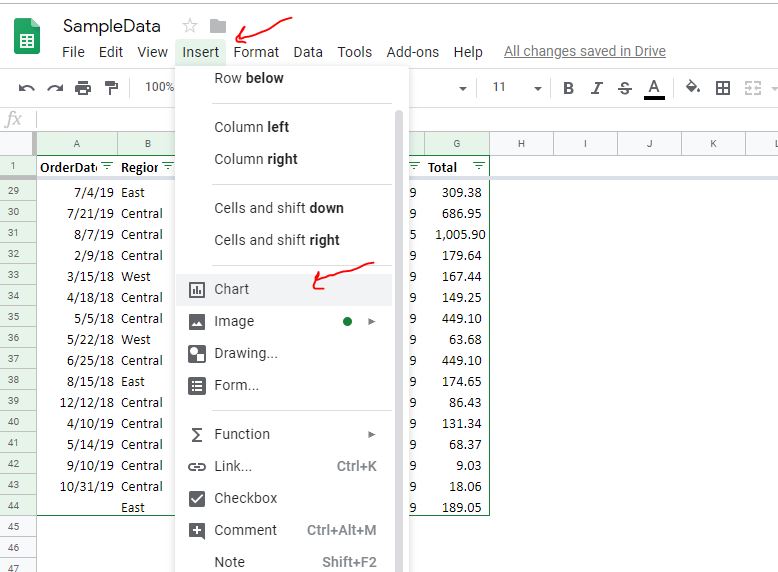
Go to Insert menu and select Chart option.
As Chart option gets activated, on the right side you will see a Chart editor with different options:
Chart type: There so many predefined charts available in Google Sheets such as Line graph, Area graph, Column graph, Bar graph, Pie graph, Scatter graph, Map graph and others: waterfall, histogram, radar, organizational, Candlestick chart, gauge chart, Timeline chart, Table chart and Treemap chart. Thus, as per your requirement select the one form the Chart type option, here we are selecting the Pie Chart.
Data range: This is an important option to get the Chart on Google Sheets. In the column of the Data range, you have to select a range of data for which you want to create a graph. For example, here we have a sheet in which the Total is the column with all final values of a particular item, so we select the G which is a column for Total header with a value from 3 to 16 i.e G3:G16.
After adding the Data range, just press the enter button and you will get your chart that will show the percentage of scattered data into one single chart to give more information.
Furthermore, the customization of the colours, position, horizontal axis, vertical axis, gridlines and more appear on the Chart can also be changed by using the Customize option given on the Chart editor.
Pivot Tables in Google Sheet
PivotTable (Pivot Table) is an interactive type table, that certain calculations, such as counting and summation. The calculations and data performed are related to the alignment in the pivot table.
It is called PivotTable because we can dynamically change it to analyze the data in different ways, or we can rearrange line numbers, column labels, and page fields. Each time you change the layout, the pivot table immediately recalculates the data according to the new layout. Also, if the original data changes, you can update the pivot table.
To create a PivotTable in Google Sheets, first, select the data from the spreadsheet that you want to use as a data source for PivotTable. If you want to use the whole data present in the sheet for Pivot Table then no need to select any particular range of data. Just move to the second step.
Note: Each column in your sheet needs a header which represents a set of data available under it.
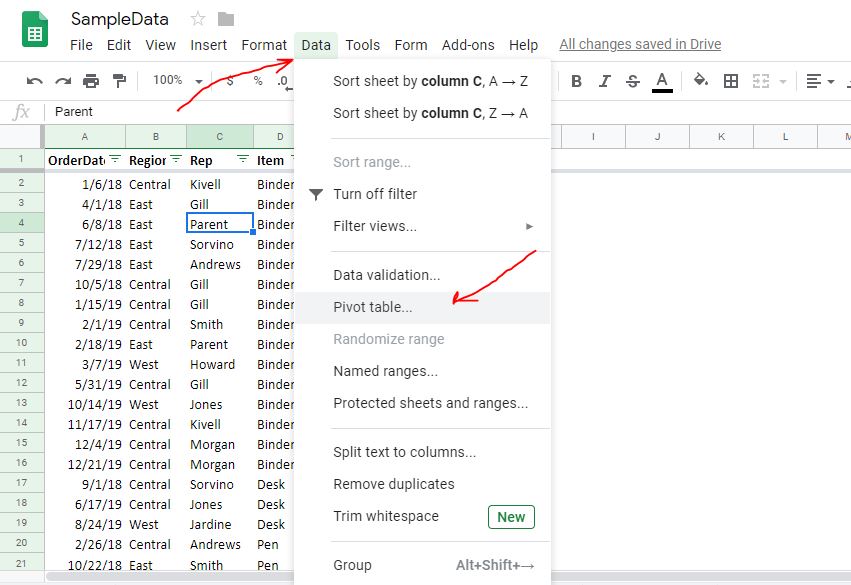
Now go to the Data menu of the Google Sheets and select the Pivot Table option.
Create a pivot table
As you select the Pivot Table, a pop-up appears which shows the Data range that has been selected by the Pivot Wizard, here we haven’t selected any particular range of Data, thus it has selected whole sheet data range. However, if you want to do some modification to data range then simply use your mouse, click and select the data range; the Pivot automatically captured that.
And the next it will ask, where you want to insert the Pivot table if you already have some sheet where you want it then select the Existing sheet otherwise New Sheet.
Finally, Create button.
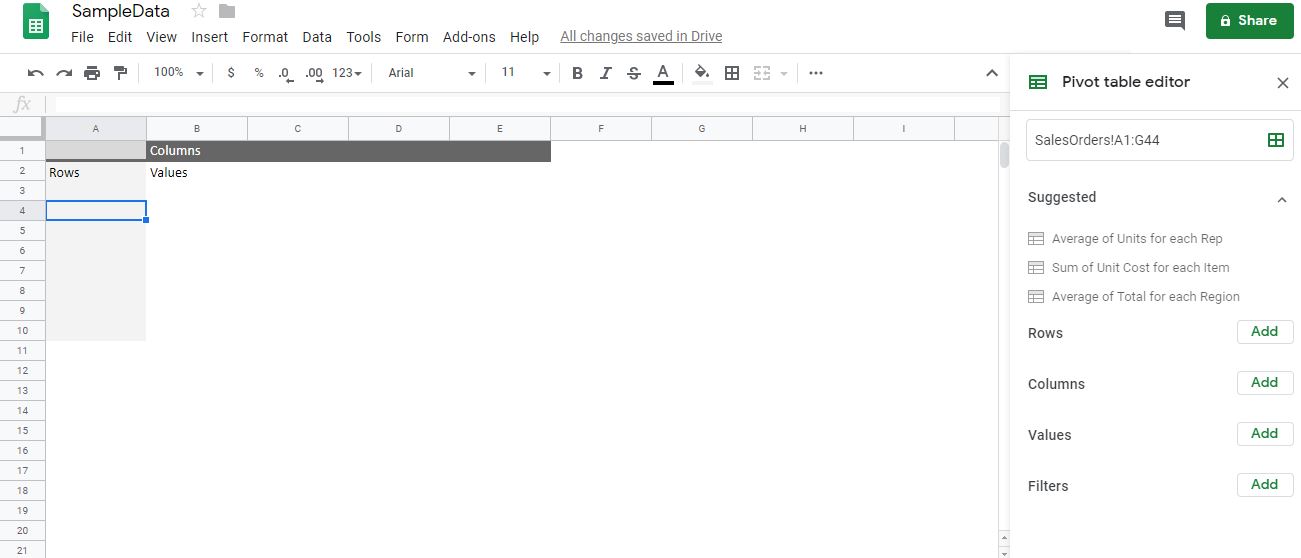
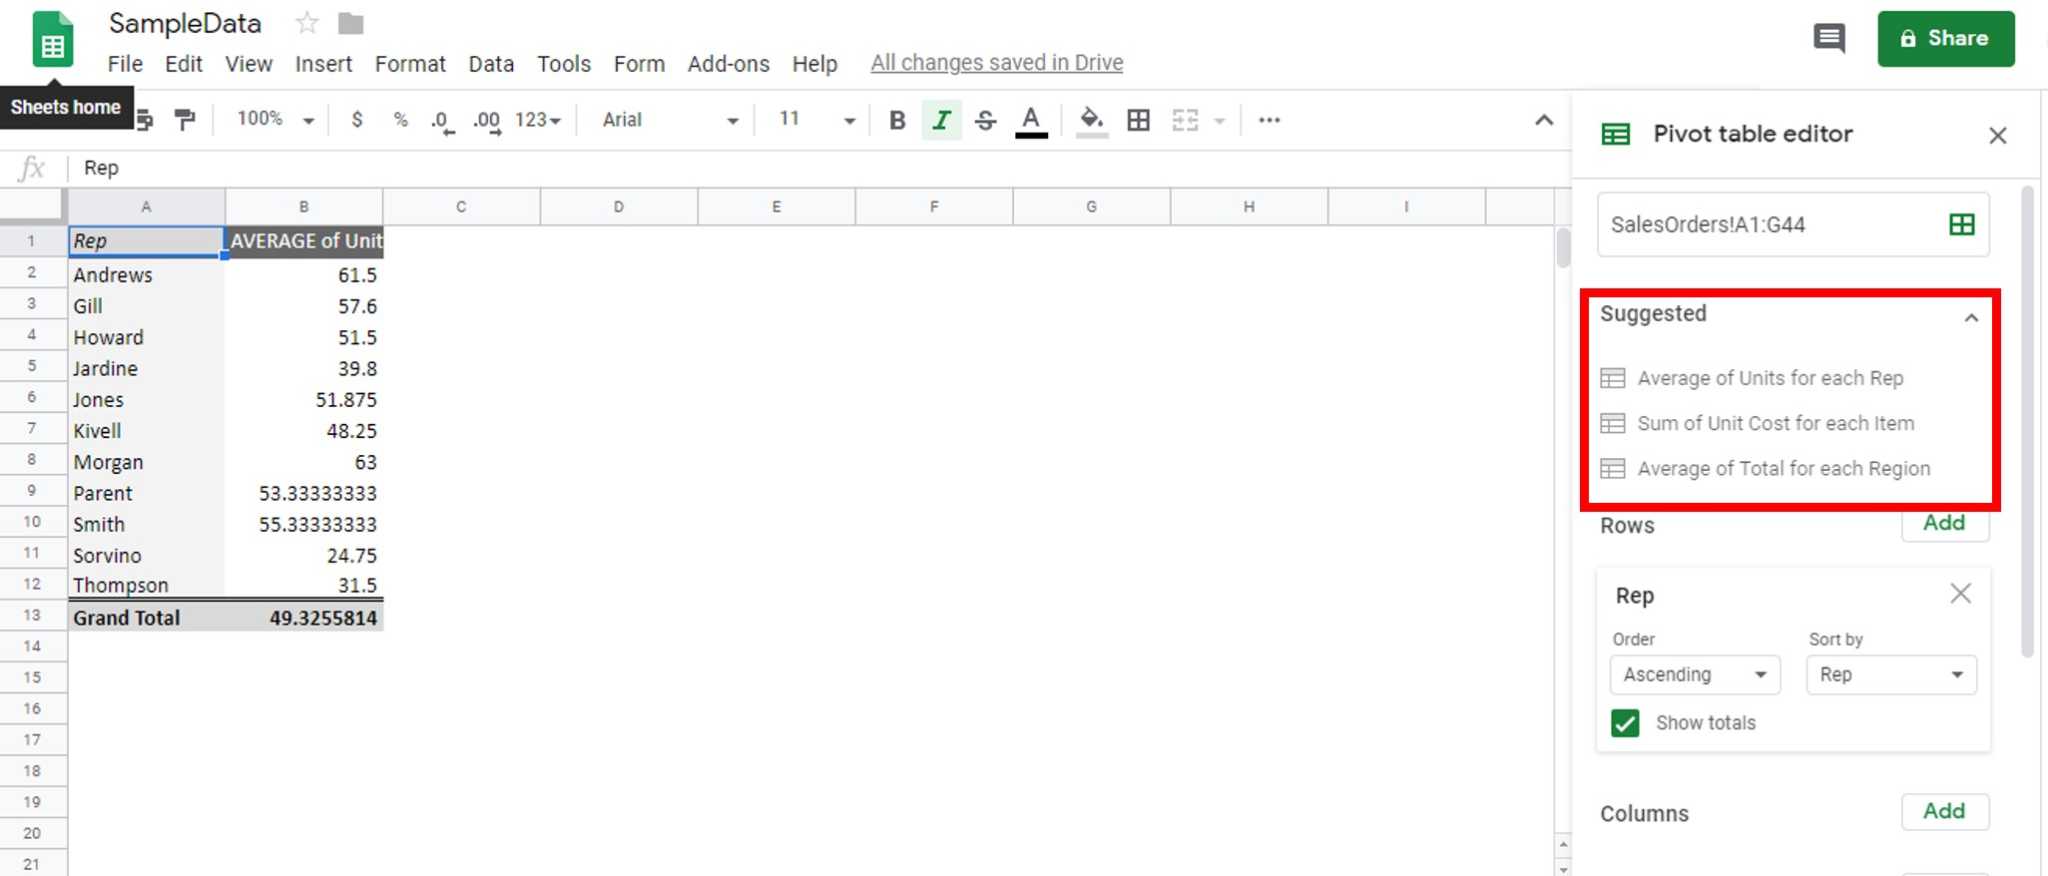
Now you will get a blank sheet but with some Rows and Columns texts. Here, we can add the data to our Pivot table either manually or using Google’s Artifical intelligence suggestions.
Using Google AI suggestions:
If you see on the right side, you will see some suggestions automatically generated by the Google Sheets using the machine learning. These suggestions are based on the data present on your source spreadsheet, however, it is not much extensive but enough to quickly add things in the Pivot table.
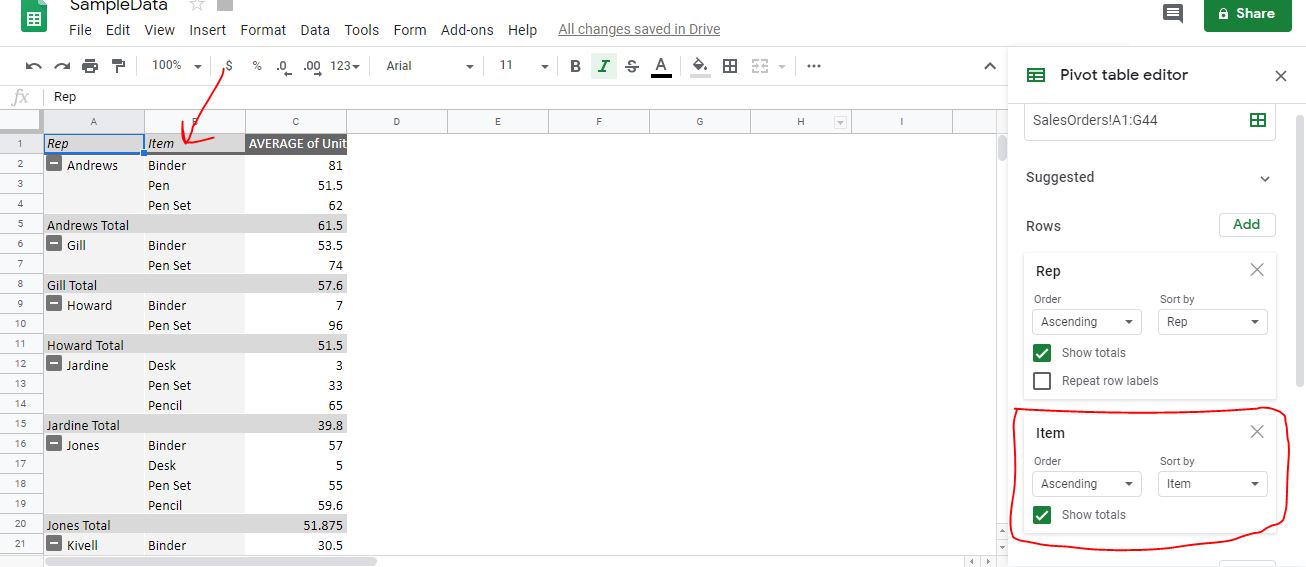
If you want to add data values manually from your source spreadsheet to pivot table then you can see in the Pivot editor options like Columns and Rows with Add button, that have to be used.
As you can see in the below screenshot, when we clicked on the Add button, it has shown all headers available for columns available in our spreadsheet. Now we can select any of them to add in the Pivot Table.
As you add rows or columns it will show under its corresponding section and also the data in pivot table itself; you can see in the below sheet we added item section of our Spreadsheet and it appears in PivotTable itself.
All the data of the PivotTable automatically synced and gets updated, when some change will happen in the Source spreadsheet.
Auto Google Sheets data analysis: Ask questions about your data from Google
As I said above the Google Sheets also provide an auto-analysis of Data for Chart, Pivot Table, Sum, Average and more… using its own Machine learning skills. Just like suggestion automatically available for data related to the pivot table, it also available for all Google spreadsheets; which we can use to get instant information and data analysis. Moreover, you can ask custom questions to Google sheets data analysis auto program that works like a breeze, indeed the questions should be related to data.
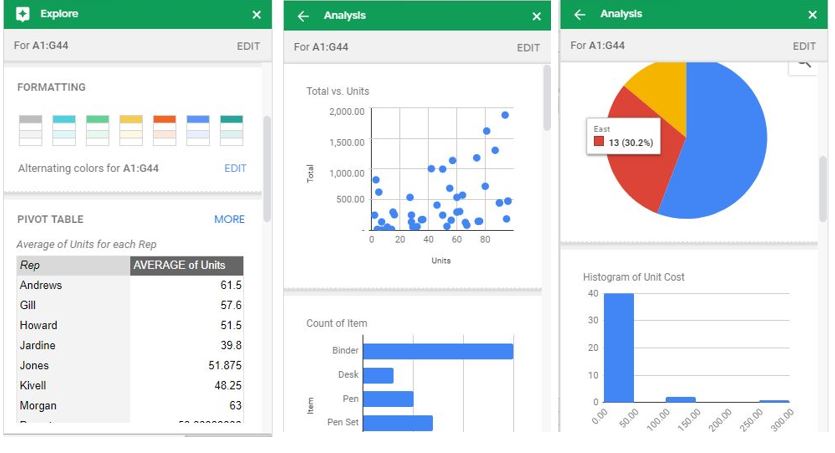
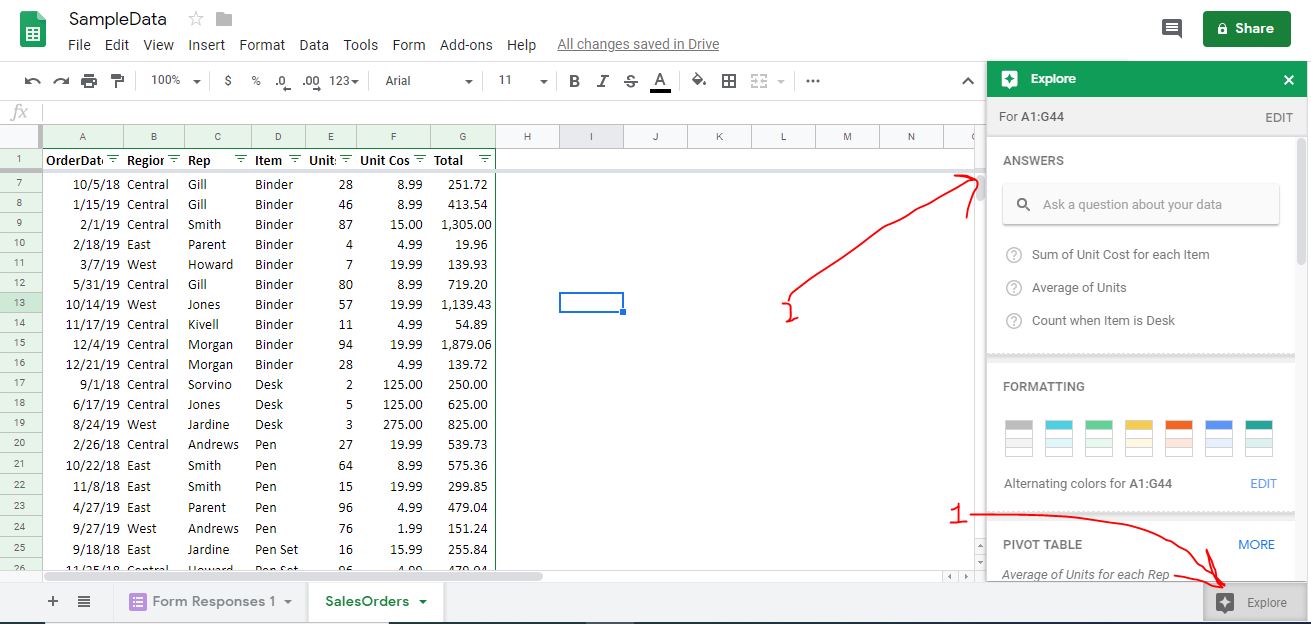
To get the auto Google Sheets data analysis right on the spreadsheet click on the Explore button given on the right bottom side. The explore pop-up will appear with all the quick results…
Here a few Auto Analysis results in screenshots
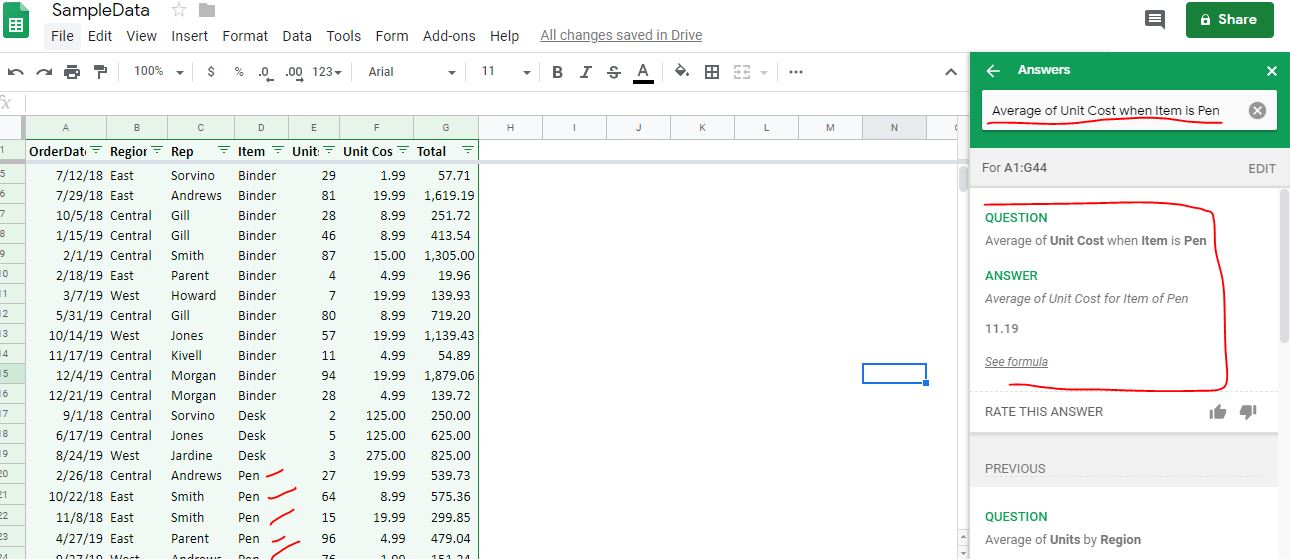
To ask questions to Google Sheet for Data Analysis you will see a search box at the beginning of the Explore window. Few auto suggestions would be there if any of them is what you want then you can use them or ask questions manually in the Search box available there.
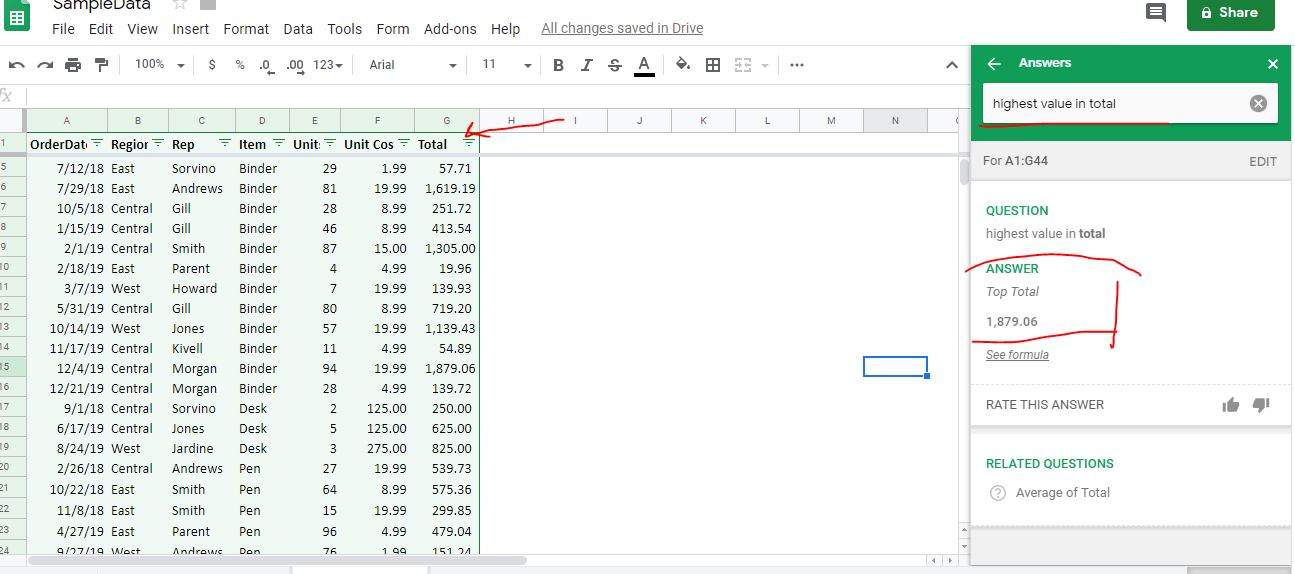
For example, we asked Google Sheets Data Analysis (auto) a couple of questions:
Average of Unit Cost when item is Pen.
Average of Units by Region
Highest value in total
In this way, we can ask multiple questions to Google Sheets Data Analysis program for quick suggest, information and data we want.
So, these are some quick features overview and a small tutorial on how we use Google Sheets for Data Analysis, however, all we mentioned above is just a glimpse a lot of things can be performed or analysed using this free business intelligence analytic tool. The biggest benefit is everything is online, no need to install anything on PC, Linux, MacOS, Android or iOS except a browser. So, what are you waiting for? Go and get your hands a little bit dirty with Google Sheets Data Analysis features.
Other Useful Resources:







Related Posts
How to create QR codes on Google Sheets for URLs or any other text elements
How to set Gemini by Google as the default Android assistant
How to create data bars in Microsoft Excel for numeric values
How to dynamically adjust column width in Microsoft Excel based on cell contents
How to do a scatter plot in Google Sheets? Easily represents the correlation between numerical values
Google’s new AI Content Moderation Policy for Play Store Apps