In order to keep your MySQL database(s) running smoothly, it is imperative that you regularly monitor a variety of key performance metrics. In recent years, several MySQL monitoring tools have been developed to make performance monitoring easier. One of the most popular is called Navicat Monitor. It’s a safe, simple and agentless remote server monitoring tool that includes many powerful features to make your monitoring effective as possible. Monitored servers include MySQL, MariaDB and SQL Server. It’s also compatible with cloud databases like Amazon RDS, Amazon Aurora, Oracle Cloud, Google Cloud and Microsoft Azure.
You can access Navicat from anywhere via a web browser to access statistics on server load and performance regarding its availability, disk usage, network I/O, table locks and more. Using this valuable data, you can easily examine possible solutions, tune the databases, and address potential issues before they can become serious problems or costly outages.
In this tutorial, we’ll learn how to connect to your SQL Server to monitor its performance remotely using Navicat Monitor.
Creating a New Instance
Navicat Monitor supports connections via secure SSH tunnel as well as SNMP protocol. Connecting via SSH Tunnel allows you to connect your servers even if remote connections are disabled or are blocked by firewalls, whereas SNMP enables the monitoring of operating system process metrics such as CPU load, RAM usage, and a variety of other resources.
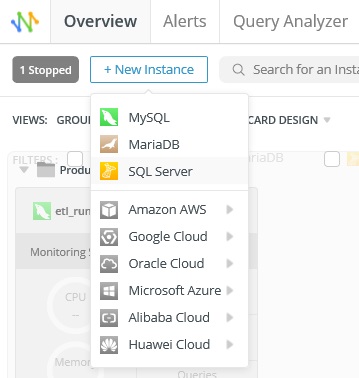
Instance information is presented on instance cards that let you identify the server status and system resource usage. To create a new instance to monitor your server, click on “New Instance” and select the server type from the dropdown list:
Even though different database vendors require slightly dissimilar connection parameters, Navicat Monitor smoothes out all of these differences by providing a New Instance dialogue that is tailored to the database type that you are connecting to.
Here’s how to connect to SQL Server:
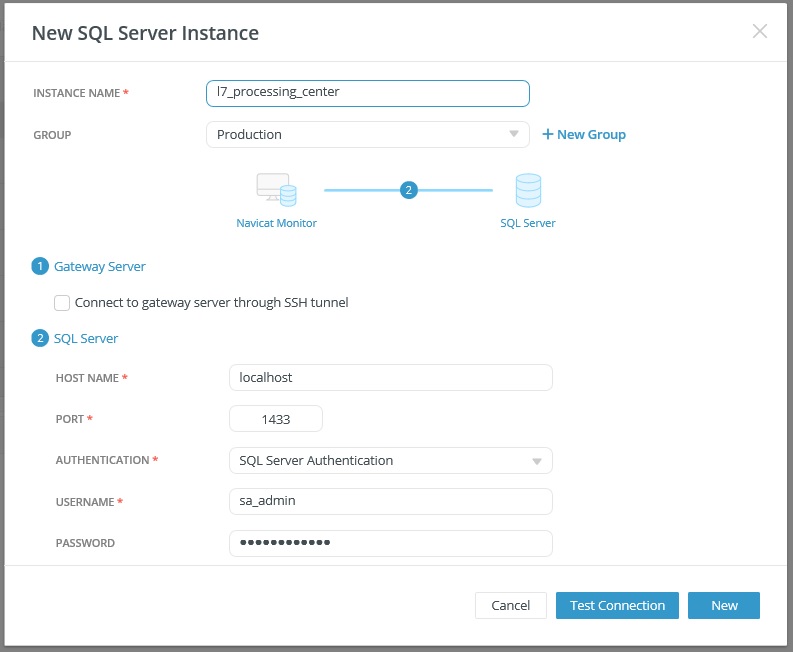
In the New Instance window, enter a descriptive name in the Instance Name field. I like to give the instance the same name that I gave it in Navicat Premium. Select the Group for your instance. If you want to add a new group, you can do so by clicking “New Group”. Then, provide the following information to connect your server:
Navicat Monitor can connect the database server over a secure SSH tunnel to send and receive monitoring data. It allows you to connect your servers even if remote connections are disabled or are blocked by firewalls.
In the SQL Server section, enter the following information:
- Host Name: The hostname or IP address of the database server.
- Port: The TCP/IP port for connecting to the database server.
- Authentication: The type of authentication to use. Supported types are SQL Server Authentication and Windows Authentication.
- Username: A monitoring user for connecting to the database server.
I would recommend creating a separate account for the monitoring user which does not cause load on the monitored instance. You should grant REPLICATION CLIENT, SUPER, PROCESS and SELECT privileges on all database object to the monitoring user. - Password: The login password of the monitoring user.
Finally, click “New “to create a new instance.
Here’s the New Instance dialogue with all of the fields filled in:
You’re now ready to start monitoring your instance!
Viewing Summary Data
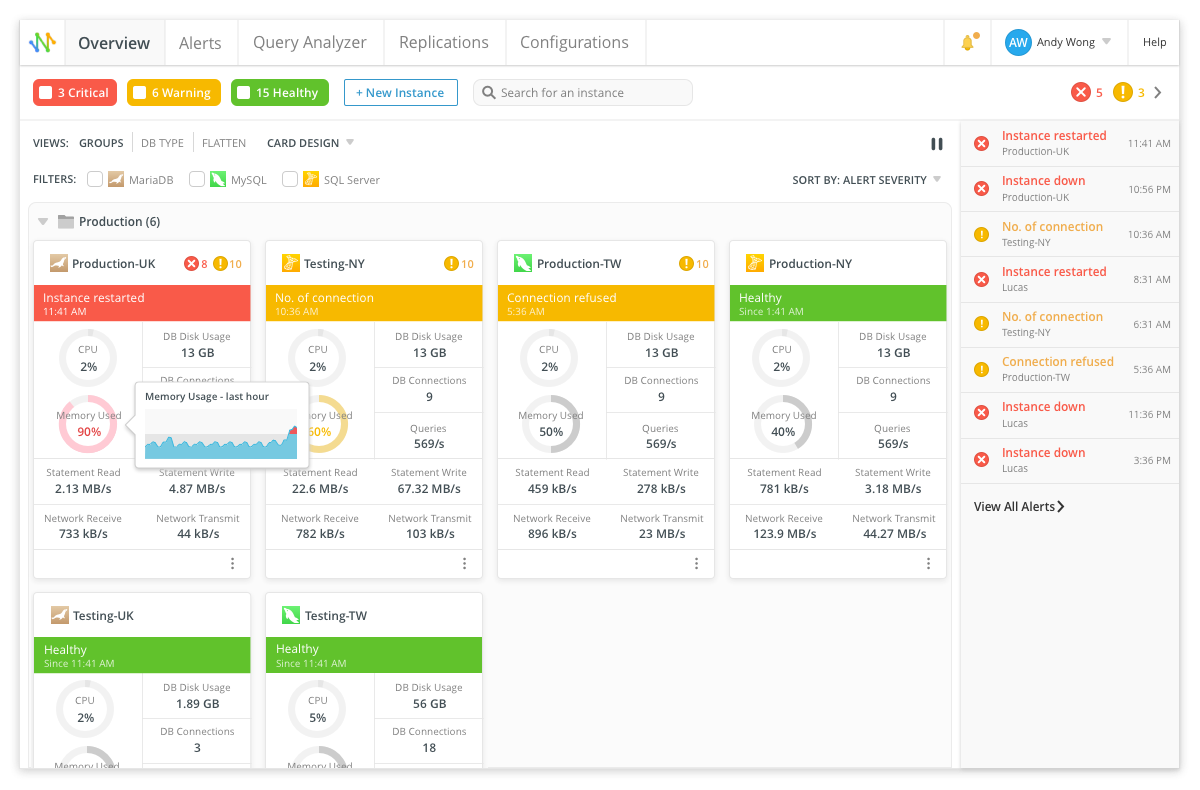
Navicat Monitor’ starting screen is the Overview Dashboard. It’s a one-stop-shop of the real-time analytics for the health and performance of all your instances. Since the introduction of Compact View in version 1.7, you can now monitor hundreds of instances at a glance! The dashboard is completely customizable so that you can view exactly the metrics that you want, as well as group instances by type and category – i.e. development, testing, production.
The Overview Dashboard can present instance information in one of two ways: Comfort View and the Compact View. Comfort View employs instance cards to let you identify the server status and system resource usage, while the latter presents a more streamlined set of data cards about each instance.
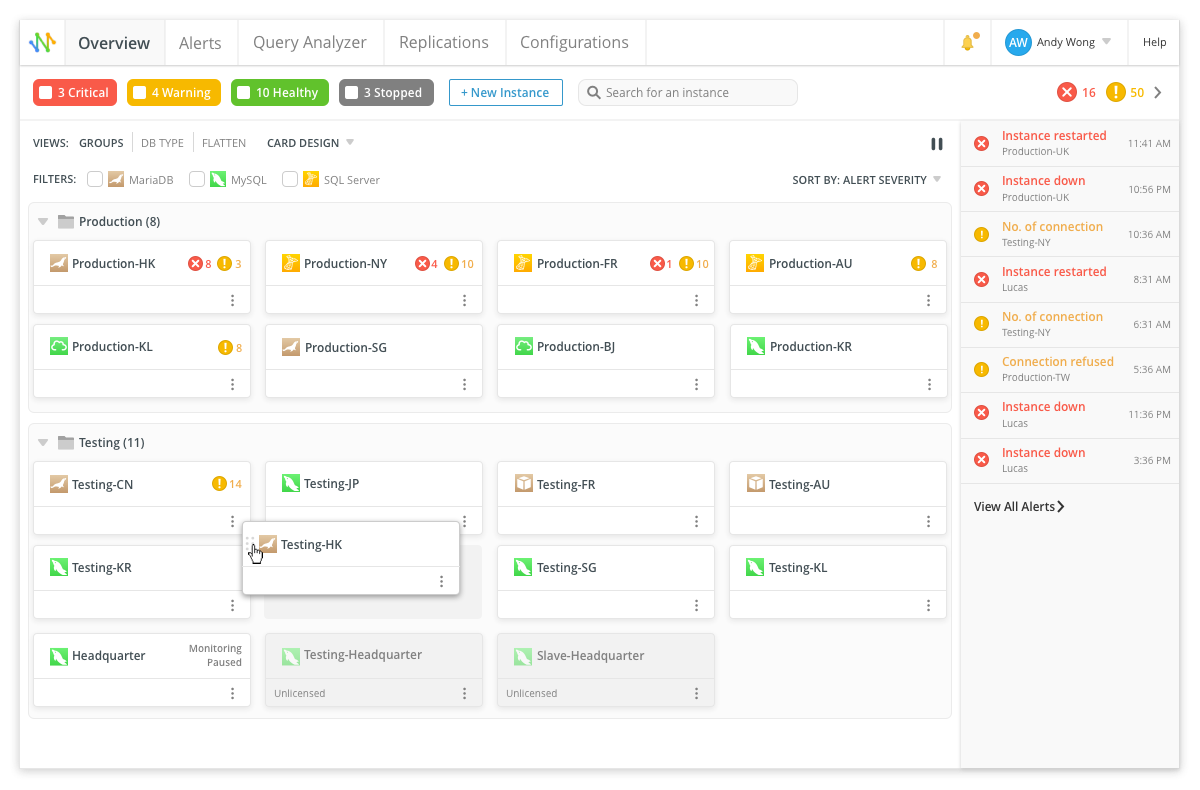
The new Compact View presents a more streamlined set of data cards about each instance, allowing you to include hundreds of database instances within a single screen!
Compact View
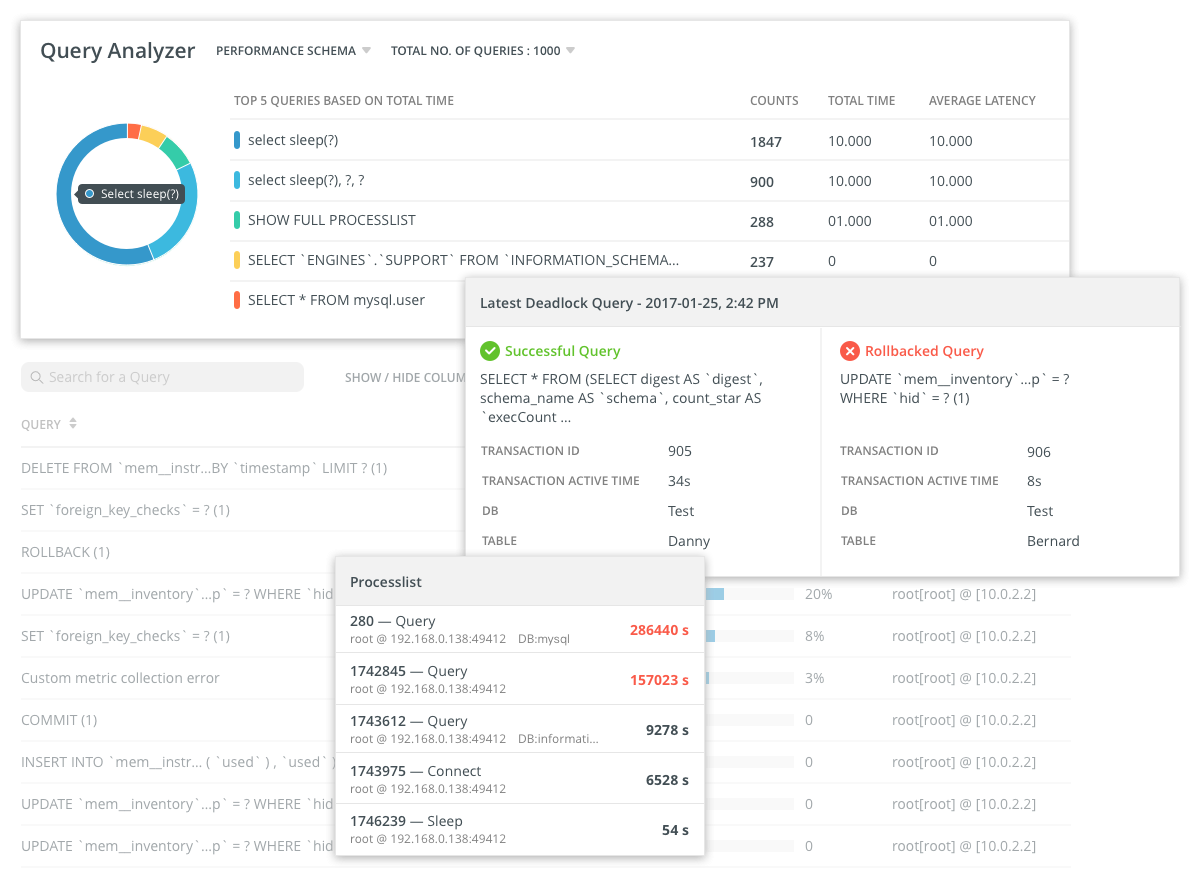
Analyzing Query Performance
Slow queries can affect database performance and overall server performance. That’s why it is a good practice to keep tabs on your queries.
The Query Analyzer screen shows the summary information of all executing queries. It can help identify fastest queries with cumulative execution time count, slow queries with unacceptable response time, and detecting deadlocks when two or more queries permanently block each other.
Slack Alerts
Slack is a collaboration hub that connects members of an organization to help get work done within a team environment. The Slack platform includes notifications for things that need your attention. Notifications are received whether you’re using Slack on your desktop or from your mobile device.
Using Navicat Monitor, DBAs may now choose to receive alerts via Slack, in addition to email, SMS, and SNMP, if they so choose.

Conclusion
In this tutorial, we learned how to connect to your SQL Server to monitor its performance remotely using Navicat Monitor. Want to give it a try? Navicat offers a 14-day free trial to get acquainted with all its features.
About The Author

Rob Gravelle resides in Ottawa, Canada. He has built web applications for numerous businesses and government agencies.
Rob’s alter-ego, “Blackjacques”, is an accomplished guitar player, who has released several CDs and cover songs. His band, Ivory Knight, was rated as one of Canada’s top hard rock and metal groups by Brave Words magazine.
Related Posts
How to Install SQL Server Express on Windows 11 using PowerShell or CMD
Install Apache, PHP & MYSQL on Windows 11 | 10 using CMD
How to create a Mysql Database on Amazon LightSail
How to install only PSQL client in Windows 11 or 10?
What is Pandas Read SQL?
PopSQL Editor Software Review: Write queries, visualize data, and share results