Create your monitoring platform by installing open-source Grafana on Ubuntu 22.04 or 20.04 Linux server for data visualization, monitoring, and observability. This article will guide you on how to do that…
Grafana is for those looking for some third-party software for creating a monitoring server system with a GUI web-based dashboard where they can create alerts for various data sources. It comes in Open source and Enterprise editions, one can choose any of them according to the needs, however, the enterprise edition is not free. It is commonly used with various data sources such as databases, cloud-based services, and monitoring systems to create interactive and customizable dashboards.
Key features of Grafana include:
- Data Visualization to create visually appealing charts and graphs from various sources.
- Data Source Integration from a wide range of data sources, including popular databases like MySQL, and PostgreSQL, and cloud services like AWS.
- Offers alerts based on specified conditions.
- User-friendly and highly customizable
- Offers a rich ecosystem of plugins and extensions.
- Community and Support
Steps to configure Grafana on Ubuntu 22.04 or 20.04
Prerequisites:
To follow the tutorial, keep a few things ready, here are those:
- Ubuntu server or desktop system.
- User account with Admin (sudo) access.
- Internet connection
Step 1: Start with Ubuntu System Update
We need to run the system update command on the Linux system from time to time, especially before installing some software package. It is because it not only installs the latest updates available for the installed applications but even refreshes the package index cache of APT. So, open your Ubuntu command terminal and run:
sudo apt update && sudo apt upgradeStep 2: Install the required extra packages
There are a few packages that we will require to perform the commands given in this tutorial, so install them using the given syntax.
sudo apt install -y apt-transport-https software-properties-common wgetStep 2: Add Grafana GPG key and Repository
To install Grafana on Ubuntu, you can use the APT package manager. However, before that, we need to add its repository and a GPG key used to sign the packages available through that repository. it is because the default Ubuntu repos don’t supply the packages we are required to install Grafana on Linux.
First, let’s add the GPG key.
sudo mkdir -p /etc/apt/keyrings/wget -q -O - https://apt.grafana.com/gpg.key | gpg --dearmor | sudo tee /etc/apt/keyrings/grafana.gpg > /dev/nullNow, add the repository:
echo "deb [arch=amd64 signed-by=/etc/apt/keyrings/grafana.gpg] https://apt.grafana.com stable main" | sudo tee -a /etc/apt/sources.list.d/grafana.listStep 3: Installing Grafana on Ubuntru 22.04 or 20.04
Once you have executed all the above-given commands your Ubuntu system will be ready to install Grafana, however, before that rerun the system update command. It is because we have manually added a new repository in the previous step and need to refresh the APT package index cache to make it recognize the newly available packages to install.
sudo apt updateNow, use APT to install the latest Grafana open source or community edition:
sudo apt install grafana(optional) Those, who are interested in the latest Enterprise edition (paid), can run this command instead of the above one:
sudo apt install grafana-enterprise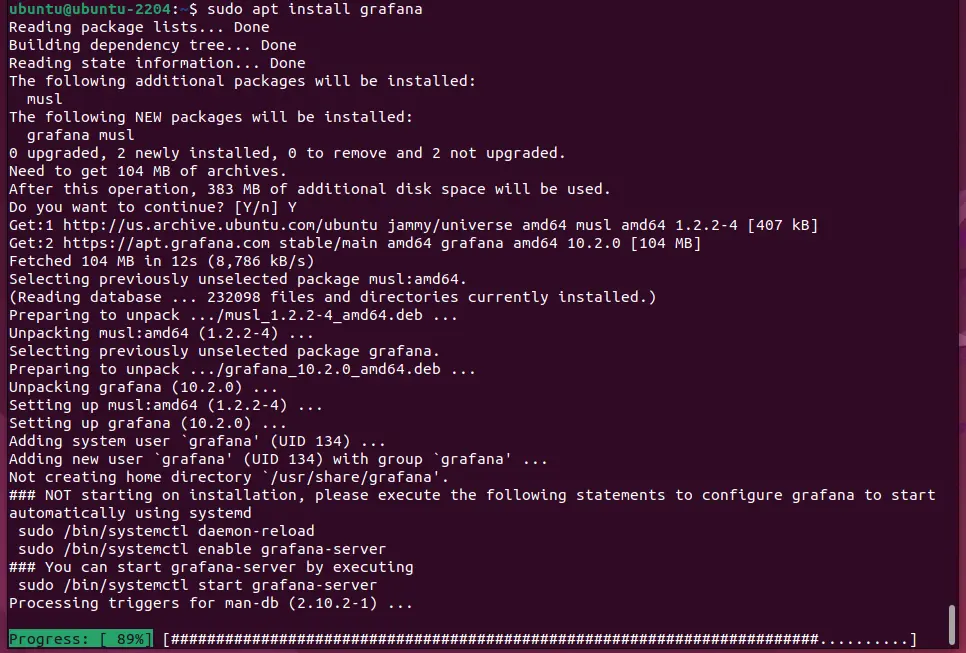
Step 4: Start Grafana service and Enable at Boot
The installation process will automatically create a service file for Grafana on our Ubuntu system that we can use to start or stop it. Whereas, those who want the Grafana to start automatically with the system boot can also mark its service enabled.
sudo systemctl start grafana-serversudo systemctl enable grafana-serverTo check the service status, we can use:
sudo systemctl status grafana-server --no-pager -l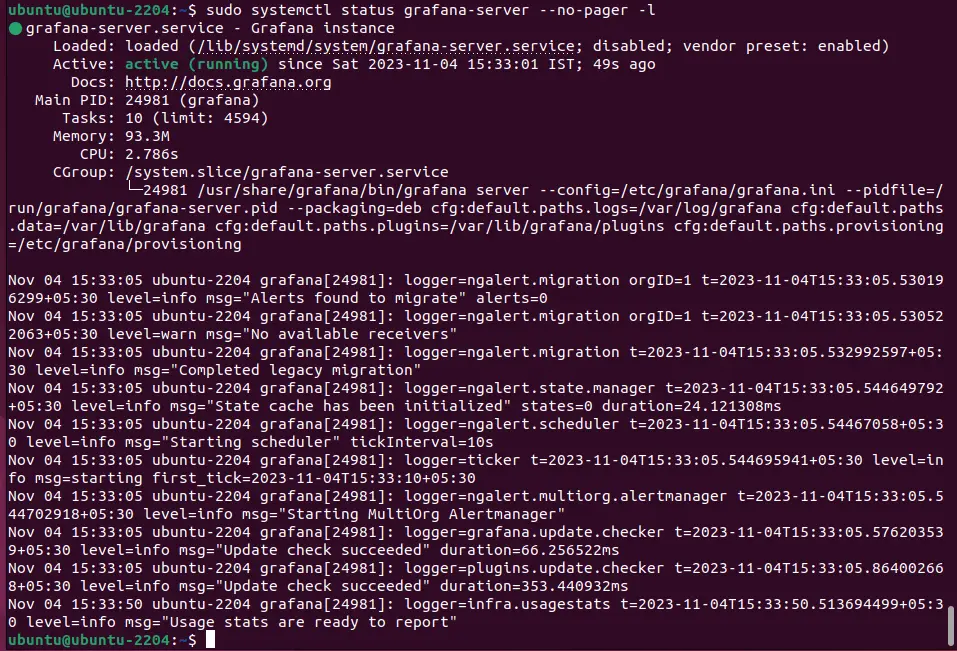
Step 5: Allow Grafana port in the Firewall
We can access the Grafana Dashboard on the local machine using its browser without any problem, however, if you are using a CLI server then definitely we need to use some other computer’s browser. Thus, to remotely access the monitoring web-based dashboard, we have to whitelist port number 3000 in our firewall.
sudo ufw allow 3000/tcpWhereas, if you are using some cloud service such as AWS or Google Cloud then open the port in the firewall provided by the server provider.
To change the port number, if required
If the 3000 port is already used with another service on your system then you will get an Empty reply from the Grafana server. In such cases use some custom port.
Note: To use a custom port edit the Grafana config file- sudo nano /usr/share/grafana/conf/defaults.ini and there, change the http_port = 3000 value.
After performing the change in port restart your server- sudo systemctl restart grafana-server
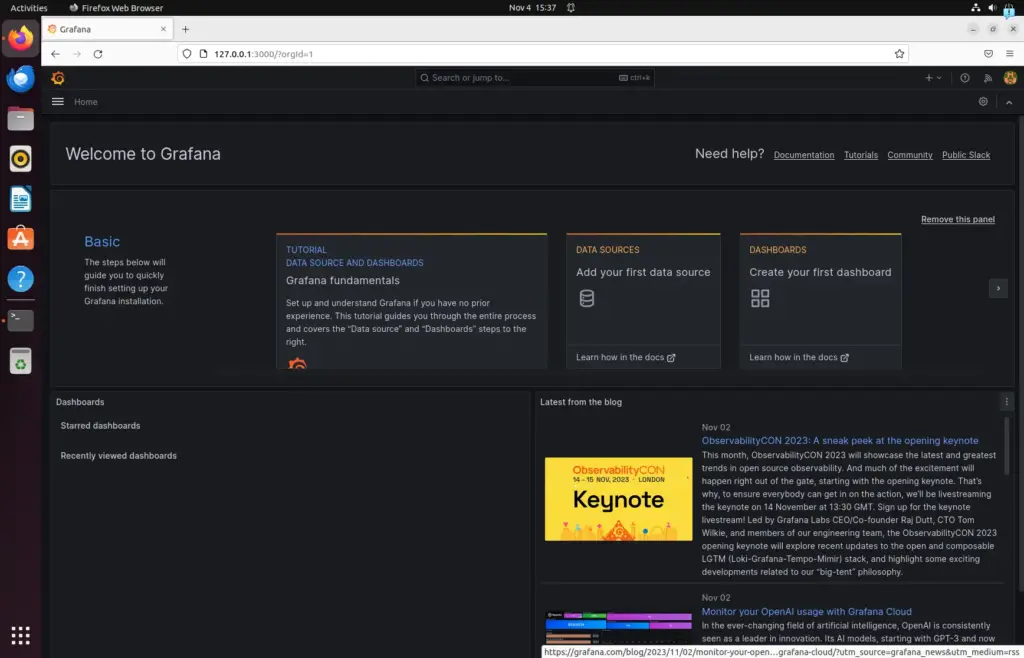
Step 6: Access the Grafana Web Interface
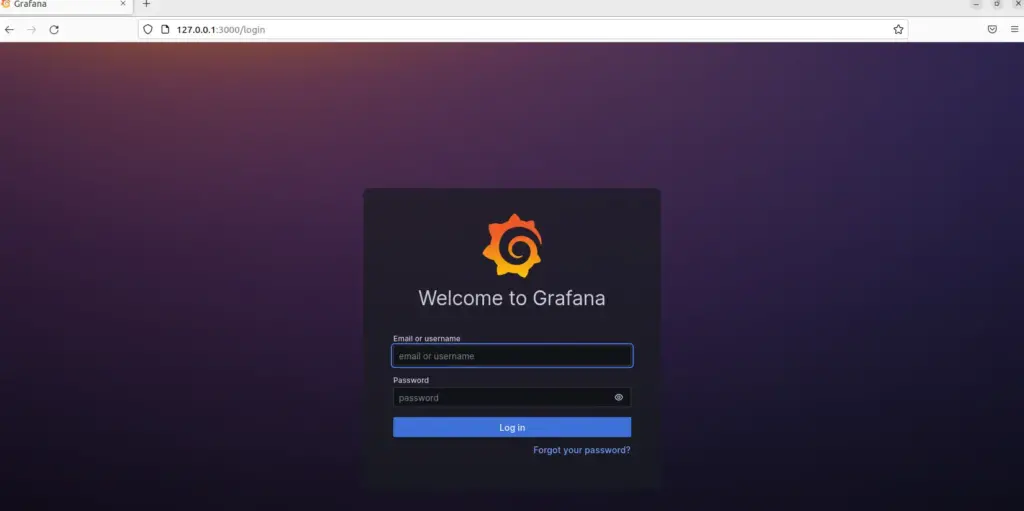
We are done with the installation part, now let’s access the GUI user interface of Grafana to perform further configurations. For this, on a system that can access the IP address of the server where you have installed this open-source monitoring solution open a browser app and type the IP address along with port number 3000 in the URL bar.
For example:
http://your_server_ip:3000The default Grafana web interface login credentials are as follows:
Username: admin
Password: admin
You’ll be prompted to change the password after the first login.
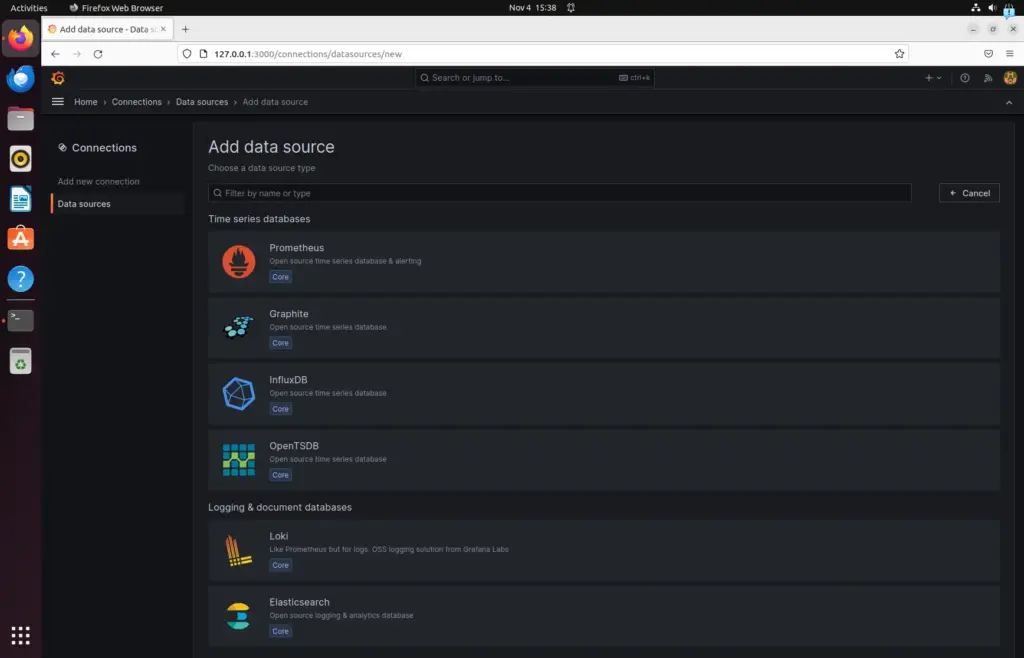
Step 7: Configure Data Sources and Create Dashboards:
Once you’ve logged in, you can start configuring data sources and creating dashboards in Grafana. This allows you to visualize data from various sources and set up monitoring and alerts as needed.
Go to Data Sources and select the source of your data. For example, here we have selected MySQL.
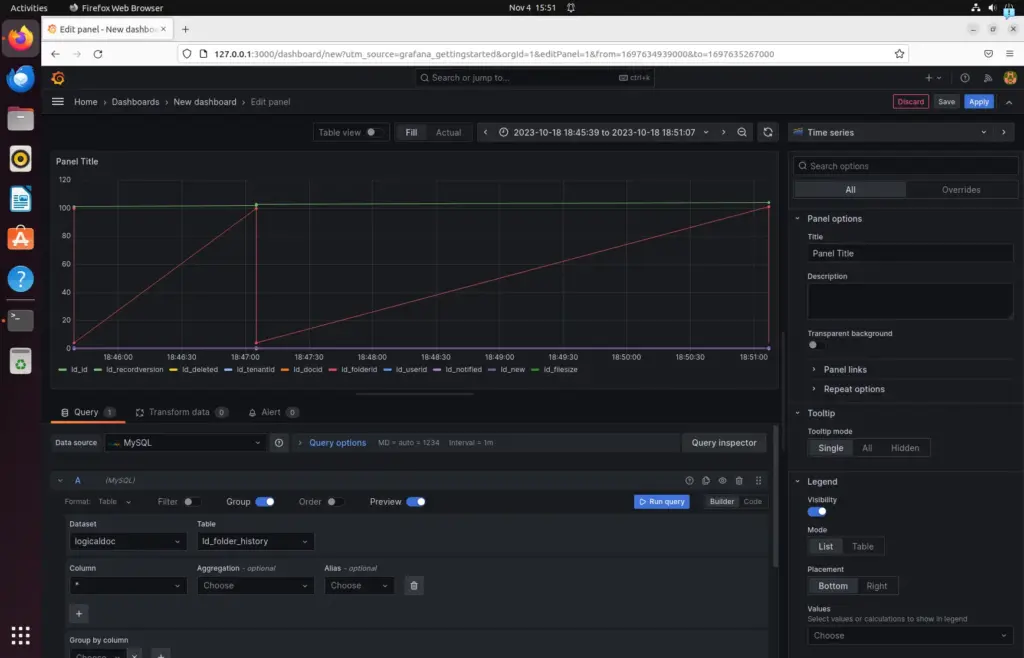
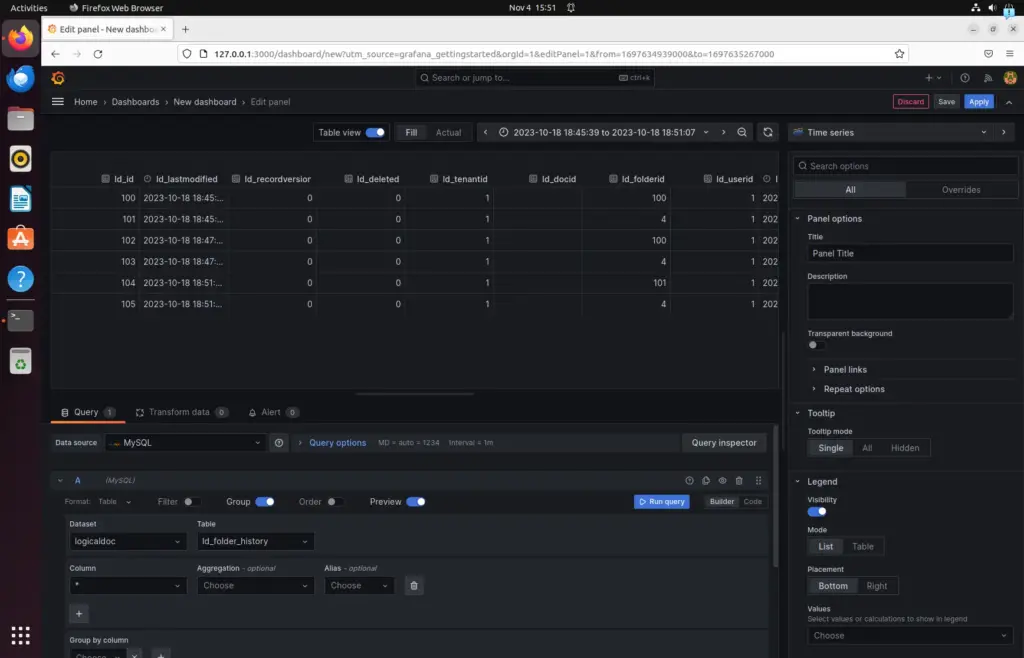
As we have selected the MySQL Database for the Data source, we create a Dashboard on Grafana where we use MYSQL as a source to display visualization and other information. After that, you can further configure it to what tables of the database you want to monitor.
Other Articles: